Question: Do you know of a solution that offers customizable data visualization for brand advertising campaign reporting?

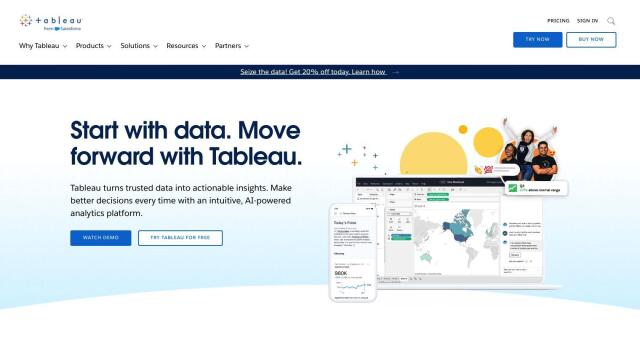
Tableau
If you're looking for a tool to provide customizable data visualization for brand advertising campaign reporting, Tableau is a top contender. It offers a business intelligence and analytics platform with a lot of features, including drag-and-drop interfaces, AI/ML abilities and a range of deployment options. Tableau has a strong presence at companies like Whole Foods Market and JLR, which means data democratization and insights are more likely to be a reality.

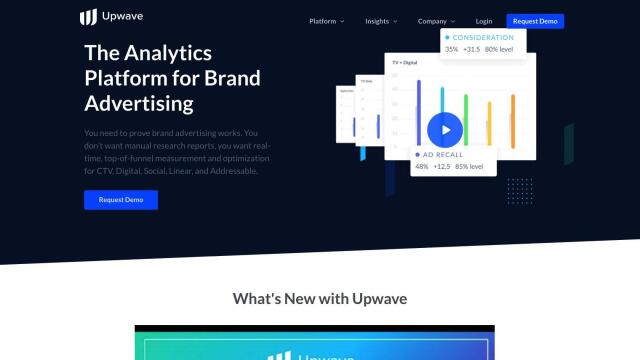
Upwave
Another strong option is Upwave, which is geared specifically for measuring and optimizing cross-channel brand campaigns. Upwave offers daily results updates, customizable data visualization, optimization recommendations and a customizable dashboard to track key performance indicators. Its advanced analytics and AI-driven insights help advertisers make data-driven decisions to optimize ROI and show the value of their brand investments.

Onvo
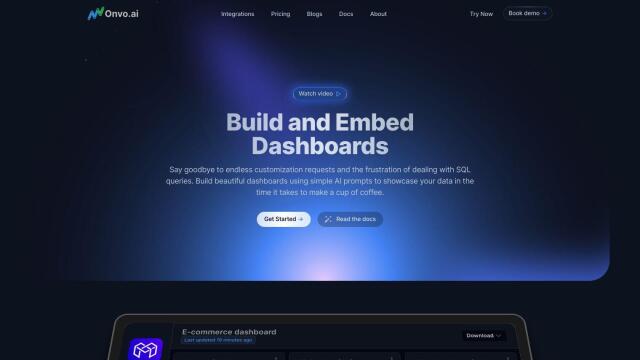
Onvo is also a good option. This AI-powered data visualization platform lets you create interactive charts and insights without having to write complicated queries. It connects to a wide variety of data sources and includes styling tools to match your brand identity. Onvo's AI technology makes data visualization easier, helping both startups and enterprises create compelling dashboards.

Polymer
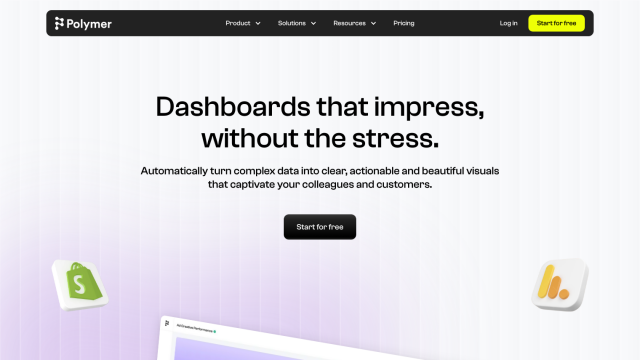
For a platform that combines AI with ease of use, Polymer is also a strong contender. Polymer transforms complex data into actionable insights and can connect to multiple data sources. It offers real-time updates and personalized visualizations through AI chat, making data-driven decisions more accessible to a wider audience. Its pre-built templates and brand customization options make it a flexible tool for campaign reporting.

