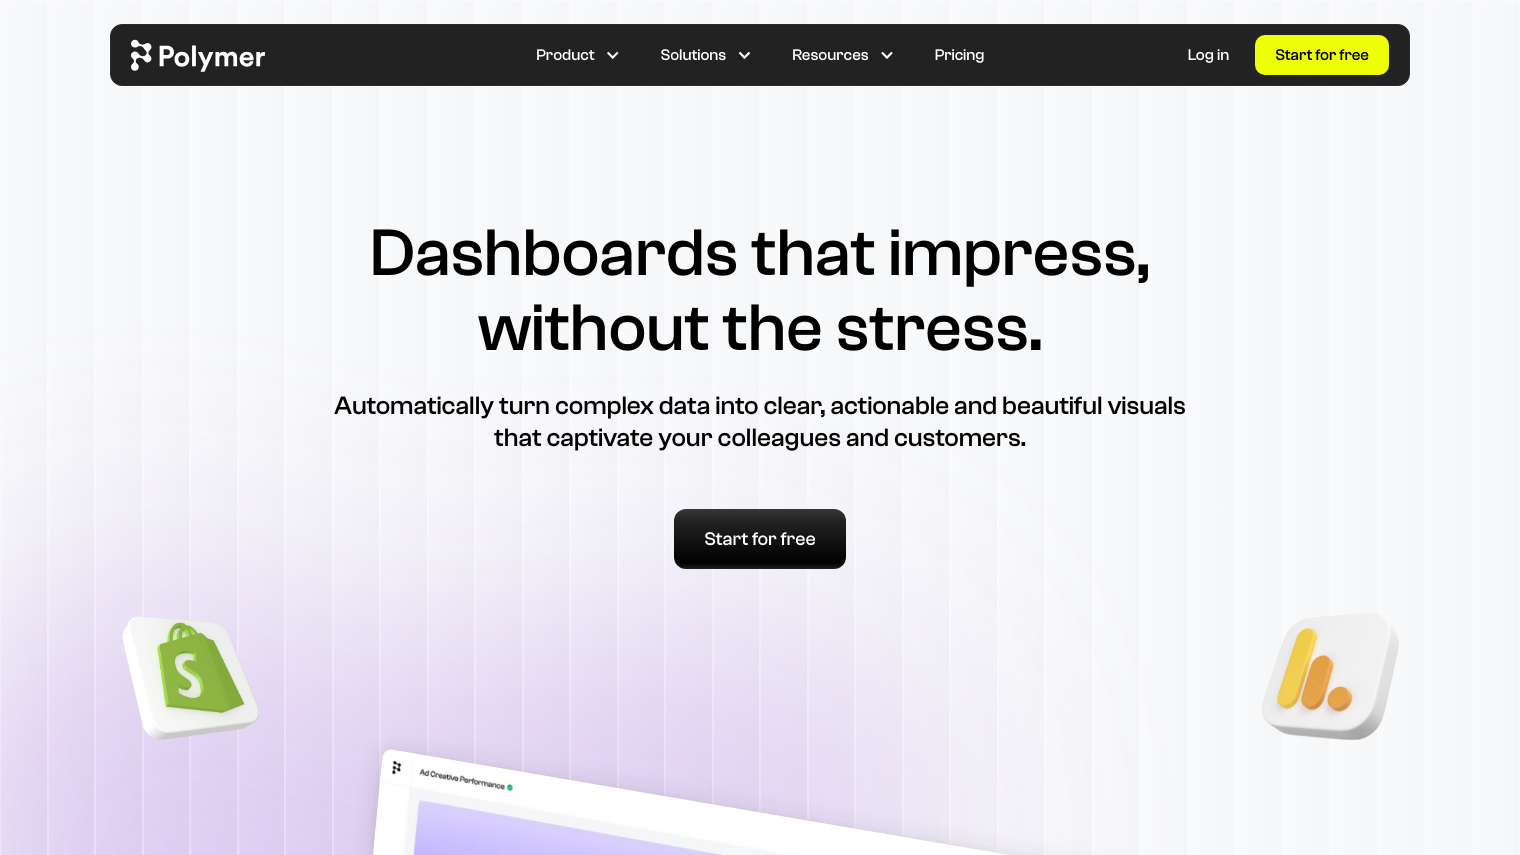
Polymer is an AI-powered dashboard builder that can convert complex data into intuitive, actionable visualizations so you can wow your coworkers and clients. It can link multiple data sources and create an initial dashboard in a matter of minutes, requiring no data science or engineering expertise.
Polymer has more than 20 data connectors to let you easily import data from sources like Google Ads, Facebook Ads, Google Sheets and more. Once connected, the dashboards update automatically so you can get real-time insights into your data.
Among Polymer's features are:
- AI-driven Insights: Polymer uses AI to generate out-of-the-box analytics and suggested insights, so you can quickly identify top-performing ads, calculate ROAS and spot trends and correlations.
- Personalized Visualization: You can ask questions about your data and generate custom visualizations using the PolyAI chat interface, letting you drill deeper and extend insights without needing a data analyst.
- Pre-built Templates: Polymer comes with a range of pre-built dashboard templates for use cases like Google Ads, Facebook Ads and Google Analytics 4, so you can get started quickly.
- Easy Sharing and Collaboration: You can share dashboards with a link or embed them into apps, and manage separate workspaces and members for different teams and projects.
- Customization: You can customize dashboards to match your brand colors and styling for a polished, engaging look.
Polymer is for anyone from small businesses to data analysts, with pricing that scales accordingly. Customers have praised Polymer for its ease of use, intuitive interface and ability to produce reports that look good.
If you're looking for a tool to make your life easier when it comes to data analysis and visualization, Polymer is a good option. It can help you quickly extract insights and present data in a format that's easy to understand, so you can make data-driven decisions fast.
Published on June 9, 2024
Related Questions
Tool Suggestions
Analyzing Polymer...


