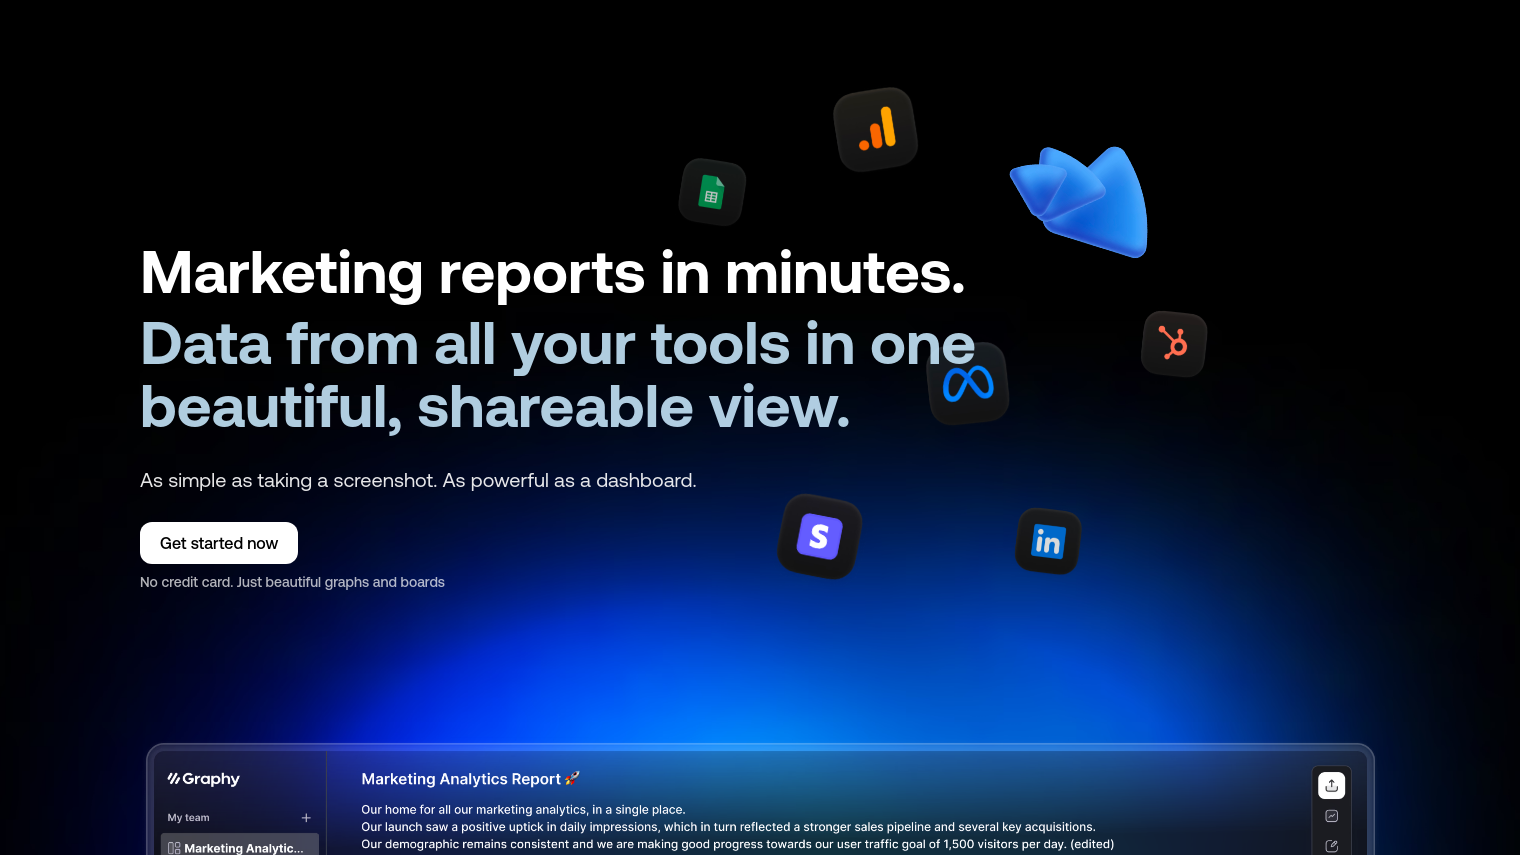
Graphy is a tool to help marketers and data-focused teams create interactive, engaging reports from multiple sources in a matter of minutes. It's designed to make it easier to present data by letting you combine data from different sources, like Hubspot, Google Analytics and LinkedIn Ads, into one view that you can share.
Among Graphy's features are:
- One-click data import: You can easily import data from a wide range of sources, including Google Sheets and Meta Ads, without complicated setup or data analysts.
- Interactive reports: You can create and update dashboards in two minutes or less so you can impress stakeholders with interactive charts.
- AI-powered productivity: You can reduce report creation time by 80% with AI-powered tools.
- Customizable visualizations: You can add annotations, goals, trend lines and even emojis to make data storytelling more engaging.
Graphy has a tiered pricing plan:
- Free: 3 boards, unlimited interactive charts, unlimited users.
- Plus: $16 per user per month, unlimited boards, custom brand colors, no Graphy watermark.
The tool is geared for data-driven marketers, growth marketing managers and anyone who wants to improve reporting while making sure stakeholders understand what they're up to. Graphy can be used for weekly and monthly reports, answering ad-hoc questions and stakeholder reports.
With Graphy, you can turn data into presentable, shareable insights that can be embedded into tools like Notion, Slack or PowerPoint or sent by email. With its interface and AI tools, Graphy can help teams work more efficiently and present data more effectively.
Published on June 11, 2024
Related Questions
Tool Suggestions
Analyzing Graphy...


