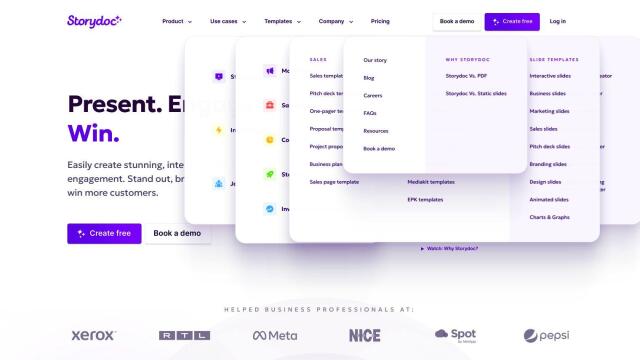
Question: I'm looking for a solution that can help me reduce report creation time and make data storytelling more engaging, do you know of any?

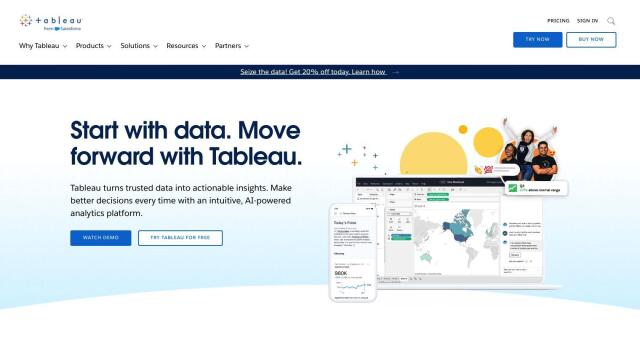
Tableau
If you want to speed up report creation and make data storytelling more compelling, Tableau is a good candidate. It's a full featured business intelligence and analytics platform with AI/ML abilities, governance and data management tools. Tableau lets you create visualizations with a drag-and-drop interface and share results, making it a good choice for collaborative data storytelling.

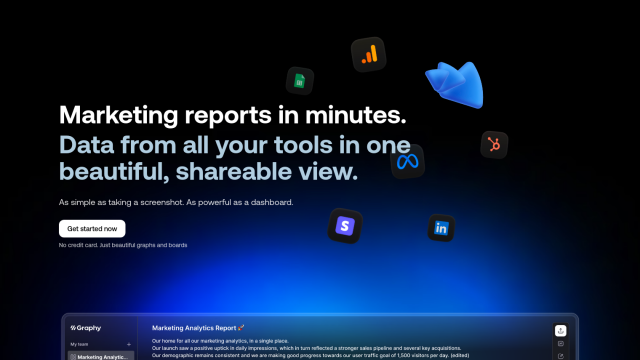
Graphy
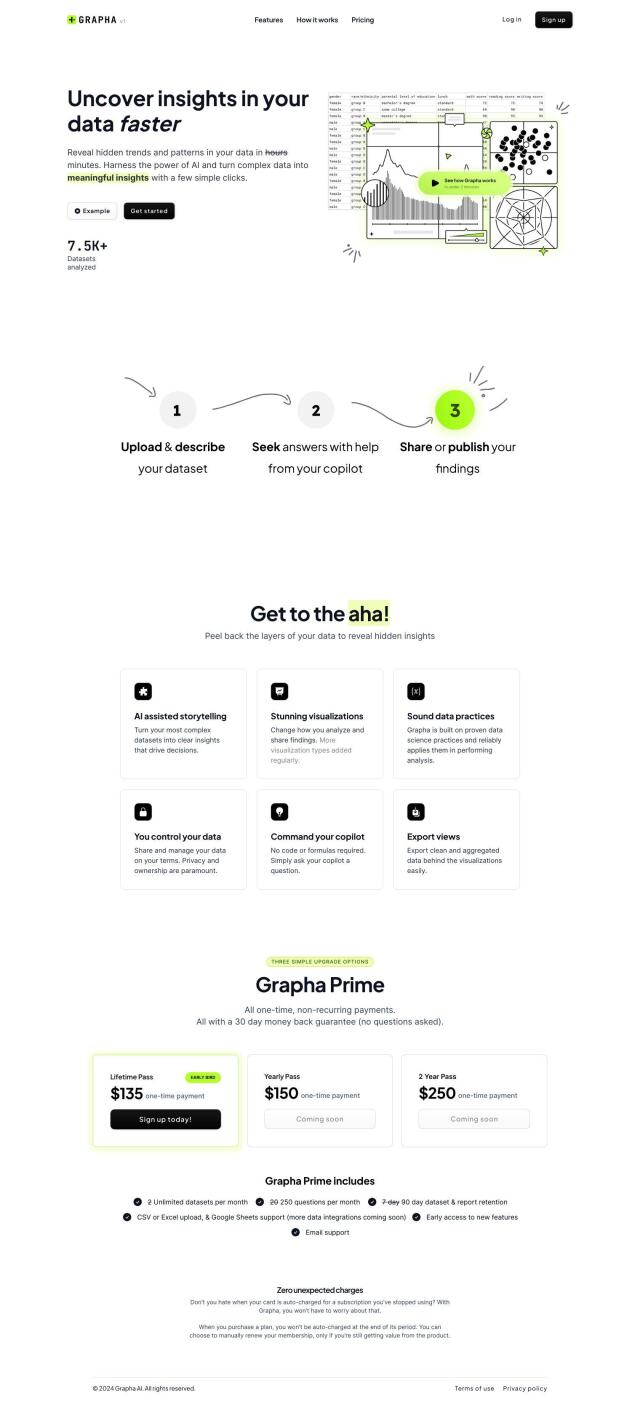
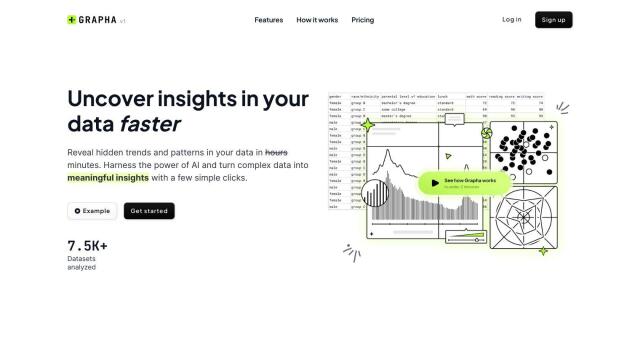
Another strong contender is Graphy, which is designed to help marketers and data-driven teams create interactive reports as fast as possible. It combines data from different sources like Google Analytics and LinkedIn Ads into a single view that can be shared, and it's got AI-powered productivity that dramatically shortens report creation time. With customizable visualization and interactive charts, Graphy is good for teams that want to automate their reporting and get stakeholders up to speed.

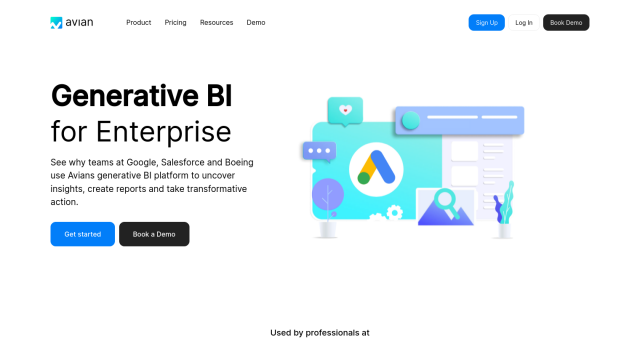
Avian
If you want a more generative BI approach, Avian has a platform that uses natural language processing to let you analyze data. It offers real-time insights without storing your data and can connect to a wide variety of data sources. With live queries and language models trained by experts, Avian can help you find insights and generate reports, and it can be a good way to get data-driven decision-making underway.

Polymer
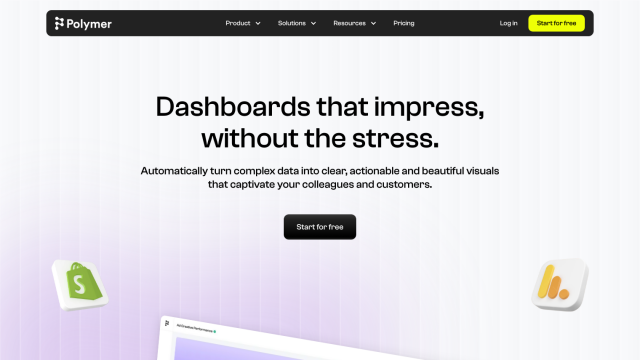
Last, Polymer has an AI-powered dashboard creation platform that turns complex data into actionable information. It can combine multiple data sources and let you create dashboards in minutes without needing data science skills. With features like personalized visualization and automated updates, Polymer lets you analyze data and present it in a way that's easy to understand, and that's a good foundation for data-driven decisions.

