Question: I need a tool that can help me create interactive charts and graphs from large datasets without requiring extensive coding knowledge.

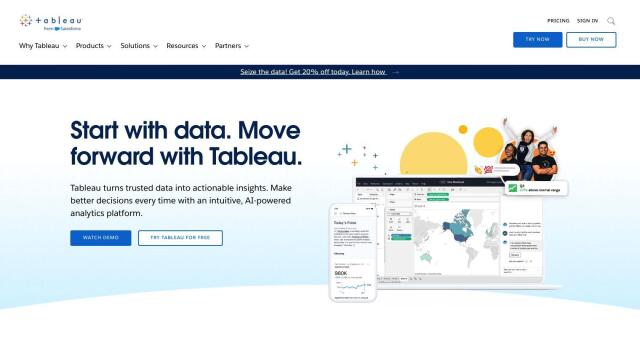
Tableau screenshot thumbnail

Tableau

Tableau is a popular business intelligence and analytics tool that connects to a broad range of data sources. It's got a drag-and-drop interface to generate visualizations, and you can share the results easily. Tableau also has AI/ML abilities, multiple deployment options and collaboration tools, so it's a good choice for companies and individuals.

Onvo screenshot thumbnail

Onvo

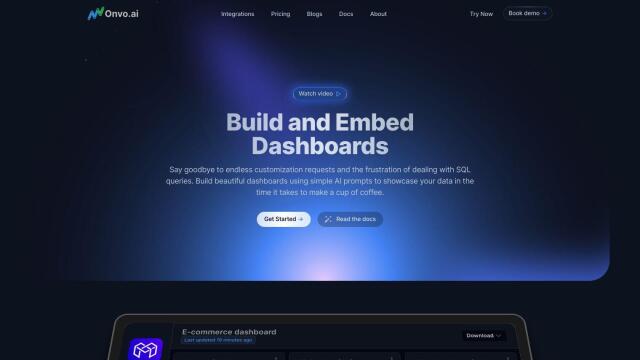
Another strong contender is Onvo, an AI-infused data visualization tool that makes it easier to generate interactive charts and insights. Onvo lets you connect to multiple data sources, create dashboards with simple AI prompts and customize styling to match your brand. Its ability to automate workflows and personalize analysis can help you save a lot of time and get more out of your data visualization work.
ChartAI screenshot thumbnail

ChartAI

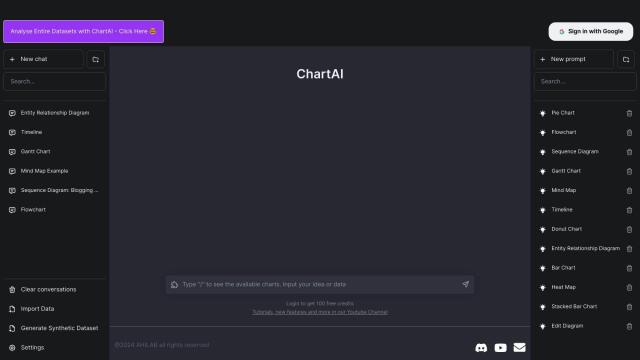
If you need a lot of different visualization options, ChartAI is a good option. The system can handle entire data sets, and it can generate a variety of visualizations, including pie charts, flowcharts and more. It's good for data analysts and project managers who need to visualize data without a lot of technical expertise.

GoodData screenshot thumbnail

GoodData

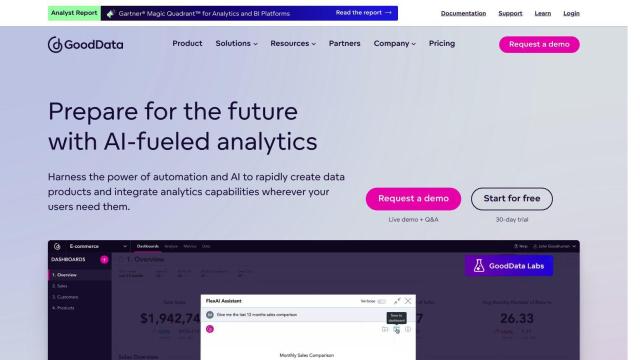
Last, GoodData offers a no-code user interface and an AI chat assistant to help you generate custom data products with interactive analytics. It can handle customizable analytics, embed analytics into different workflows, and has an interface that's easy to use, so it's a good option for data analysts and engineers trying to automate their workflows.

Additional AI Projects

Graphy screenshot thumbnail

Graphy

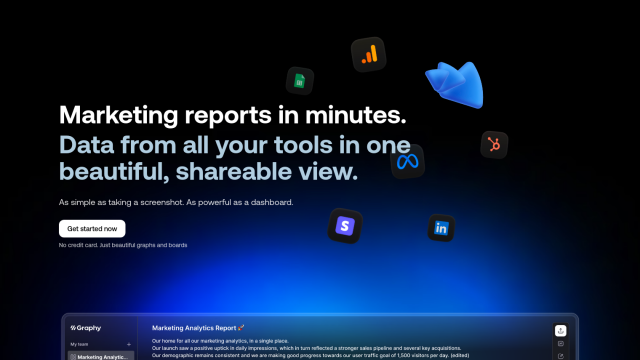
Combine data from multiple sources into interactive, shareable reports in minutes, with AI-powered tools reducing creation time by 80%.

ChartFast screenshot thumbnail

ChartFast

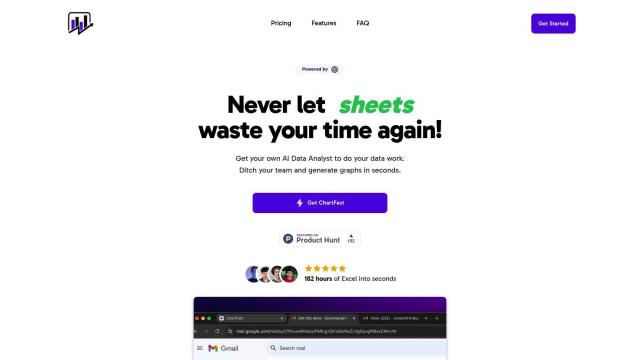
Automates data visualization and analysis, creating detailed graphs in seconds, while handling common data problems like missing values and outliers.
DataChat screenshot thumbnail

DataChat

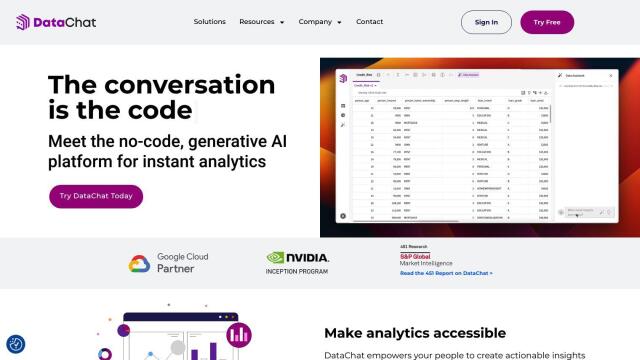
Access complex data insights without coding, using a familiar chat and spreadsheet interface to generate transparent, reproducible results.

Polymer screenshot thumbnail

Polymer

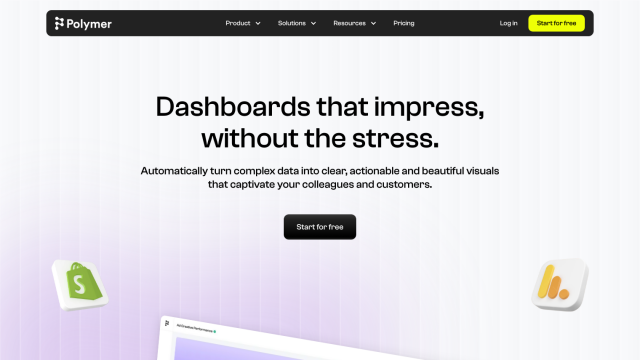
Converts complex data into intuitive, actionable visualizations, linking multiple sources and generating real-time insights with AI-driven analytics and suggested trends.

TalktoData screenshot thumbnail

TalktoData

Ask questions in plain English and get immediate answers and visualizations from connected data sources, without needing to write code or wrangle data.

Tabula screenshot thumbnail

Tabula

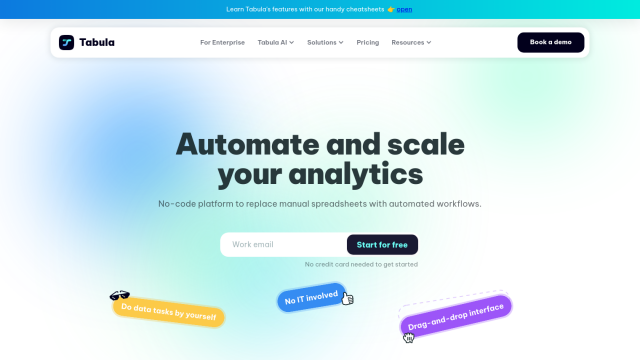
Automate data workflows, standardize disparate sources, and gain real-time insights without coding, empowering data-driven decision-making across departments.

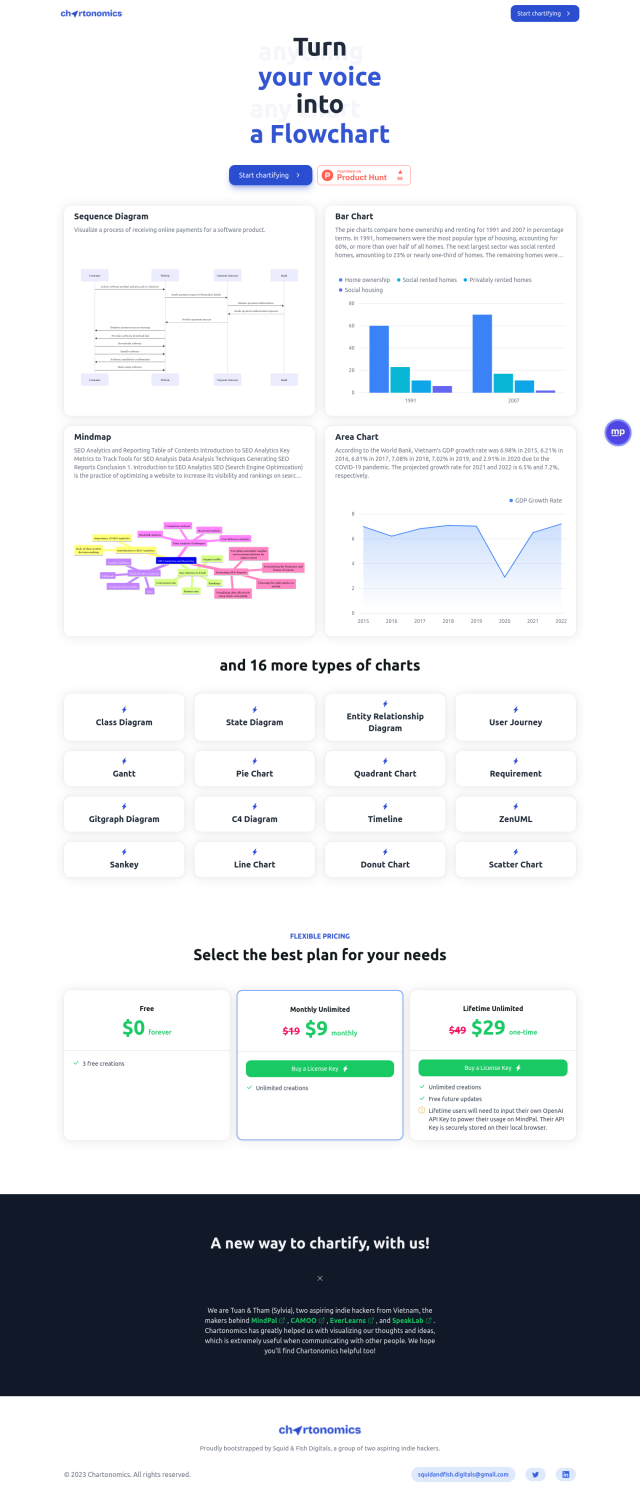
Chartonomics screenshot thumbnail

Chartonomics

Convert any data into 20+ chart types with a single click, no setup required, for instant visualization and communication of complex ideas.

Grapha.ai screenshot thumbnail

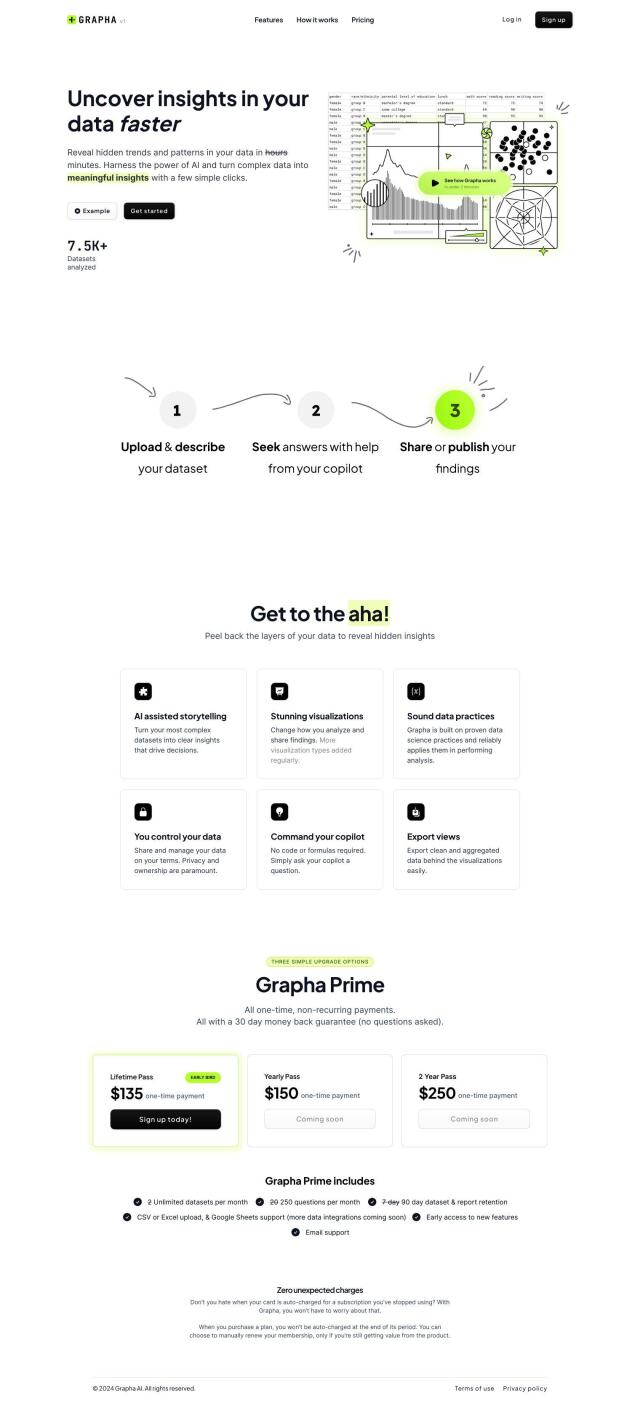
Grapha.ai

Explore complex data with AI-driven trend and pattern detection, and turn data into actionable insights with a simple, accessible interface.

Canvas screenshot thumbnail

Canvas

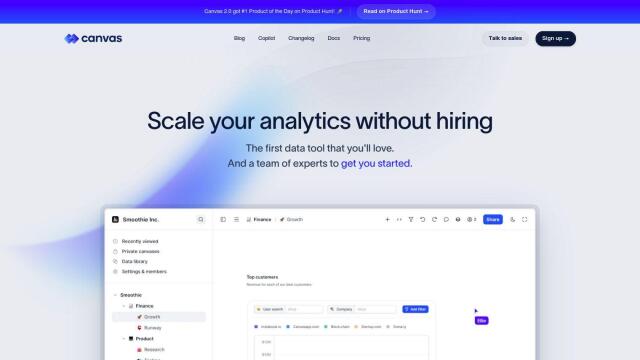
Link, query, and visualize data from 150+ SaaS tools without coding, empowering non-technical teams to make data-informed decisions.

Image Charts screenshot thumbnail

Image Charts

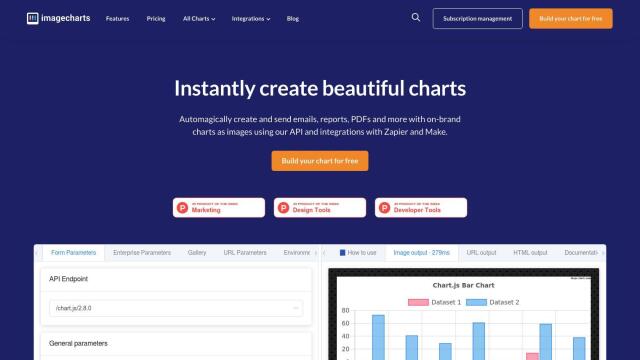
Automatically create custom charts from data, including line, pie, and scatter charts, with branding and embedding options for seamless integration.

Vizly screenshot thumbnail

Vizly

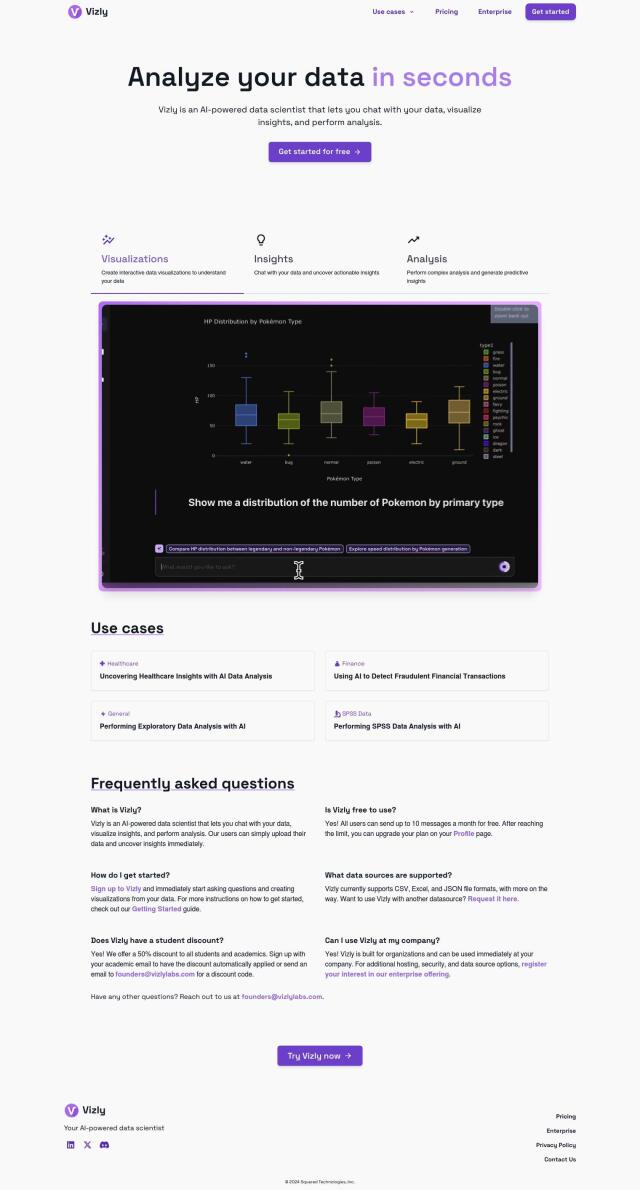
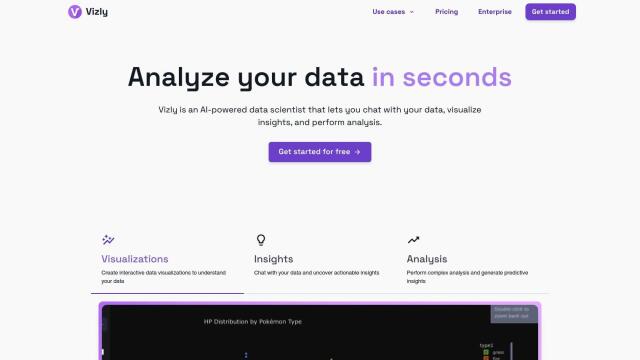
Interactively analyze data by asking questions, visualizing results, and performing advanced analysis to uncover insights and predictions.

Vizzly screenshot thumbnail

Vizzly

Build and share interactive, customizable analytics experiences with a no-code dashboard builder, empowering users to explore data without technical hassle.

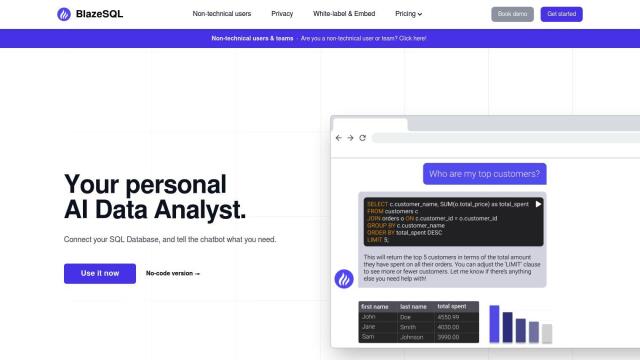
Blaze SQL screenshot thumbnail

Blaze SQL

Ask a question, get instant data insights with automated SQL queries, charts, and dashboards, no coding required.

Spreadsheet.com screenshot thumbnail

Spreadsheet.com

Combines spreadsheet interface with automation, customizable views, and integrations to streamline project management, data tracking, and team collaboration.

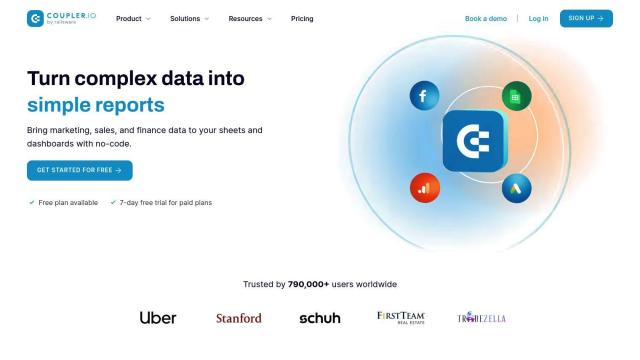
Coupler.io screenshot thumbnail

Coupler.io

Easily gather, visualize, and automate data from 200+ integrations with a drag-and-drop interface, empowering data-driven decisions without requiring coding expertise.

Streamlit screenshot thumbnail

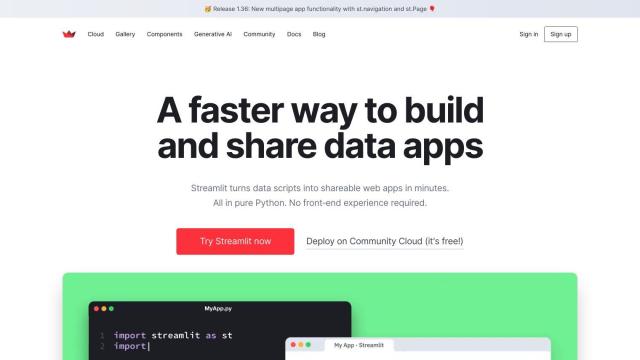
Streamlit

Build interactive data apps with a few lines of code, and deploy instantly with a single click, without needing front-end programming expertise.

Visme screenshot thumbnail

Visme

Create on-brand content fast with AI-assisted design, templates, and collaboration tools, even without design experience.

Columns screenshot thumbnail

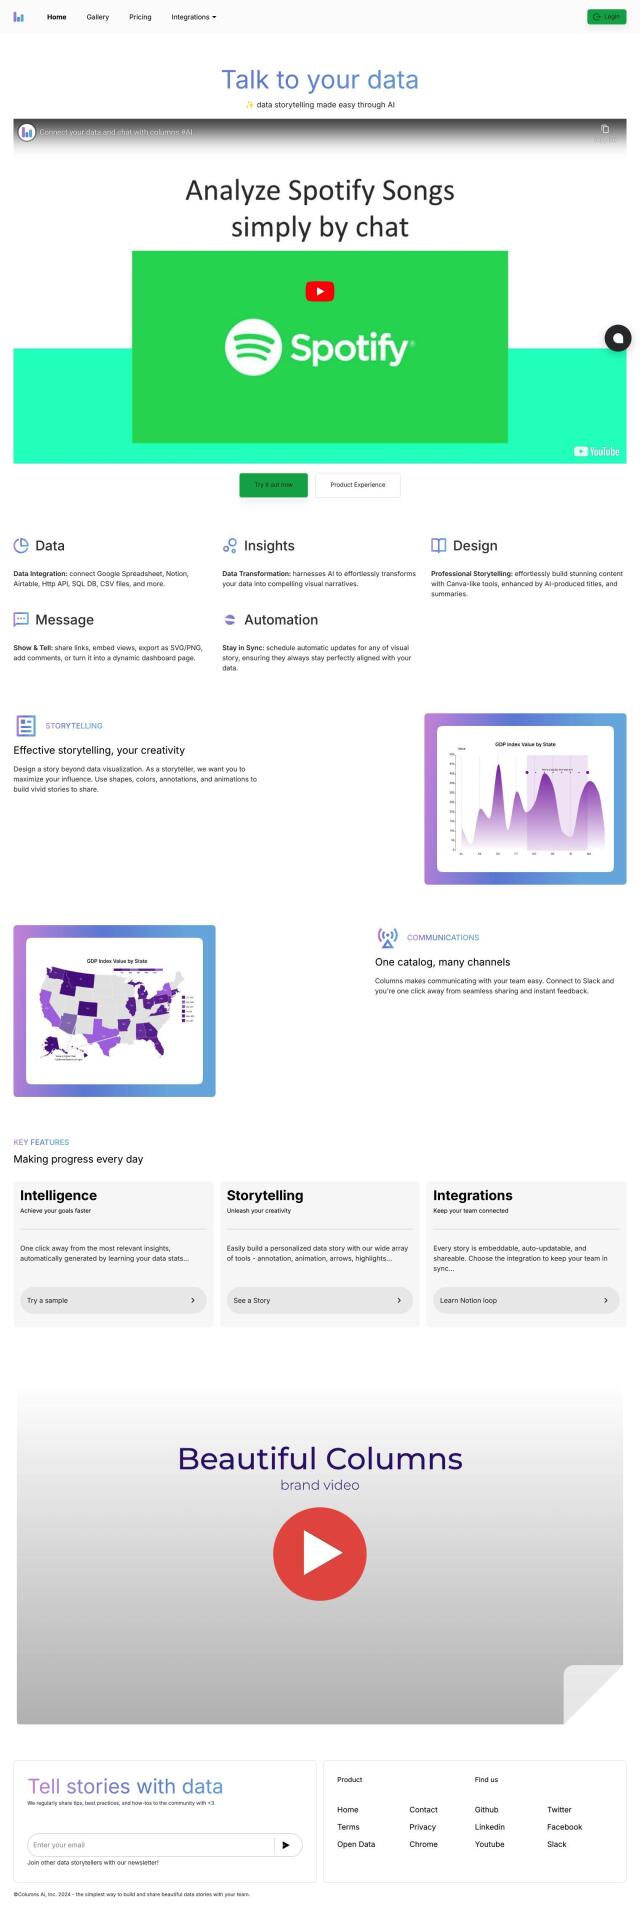
Columns

Collaborate on data visualization projects, manage data catalogs, and create compelling stories with AI-assisted insights, all in one self-service platform.

Tractorscope screenshot thumbnail

Tractorscope

Turn complex data into meaningful insights with customizable dashboards and charts.

Skills.ai screenshot thumbnail

Skills.ai

Generate data-infused articles, reports, and presentations without coding, leveraging AI-driven analytics to turn data into actionable insights in minutes.