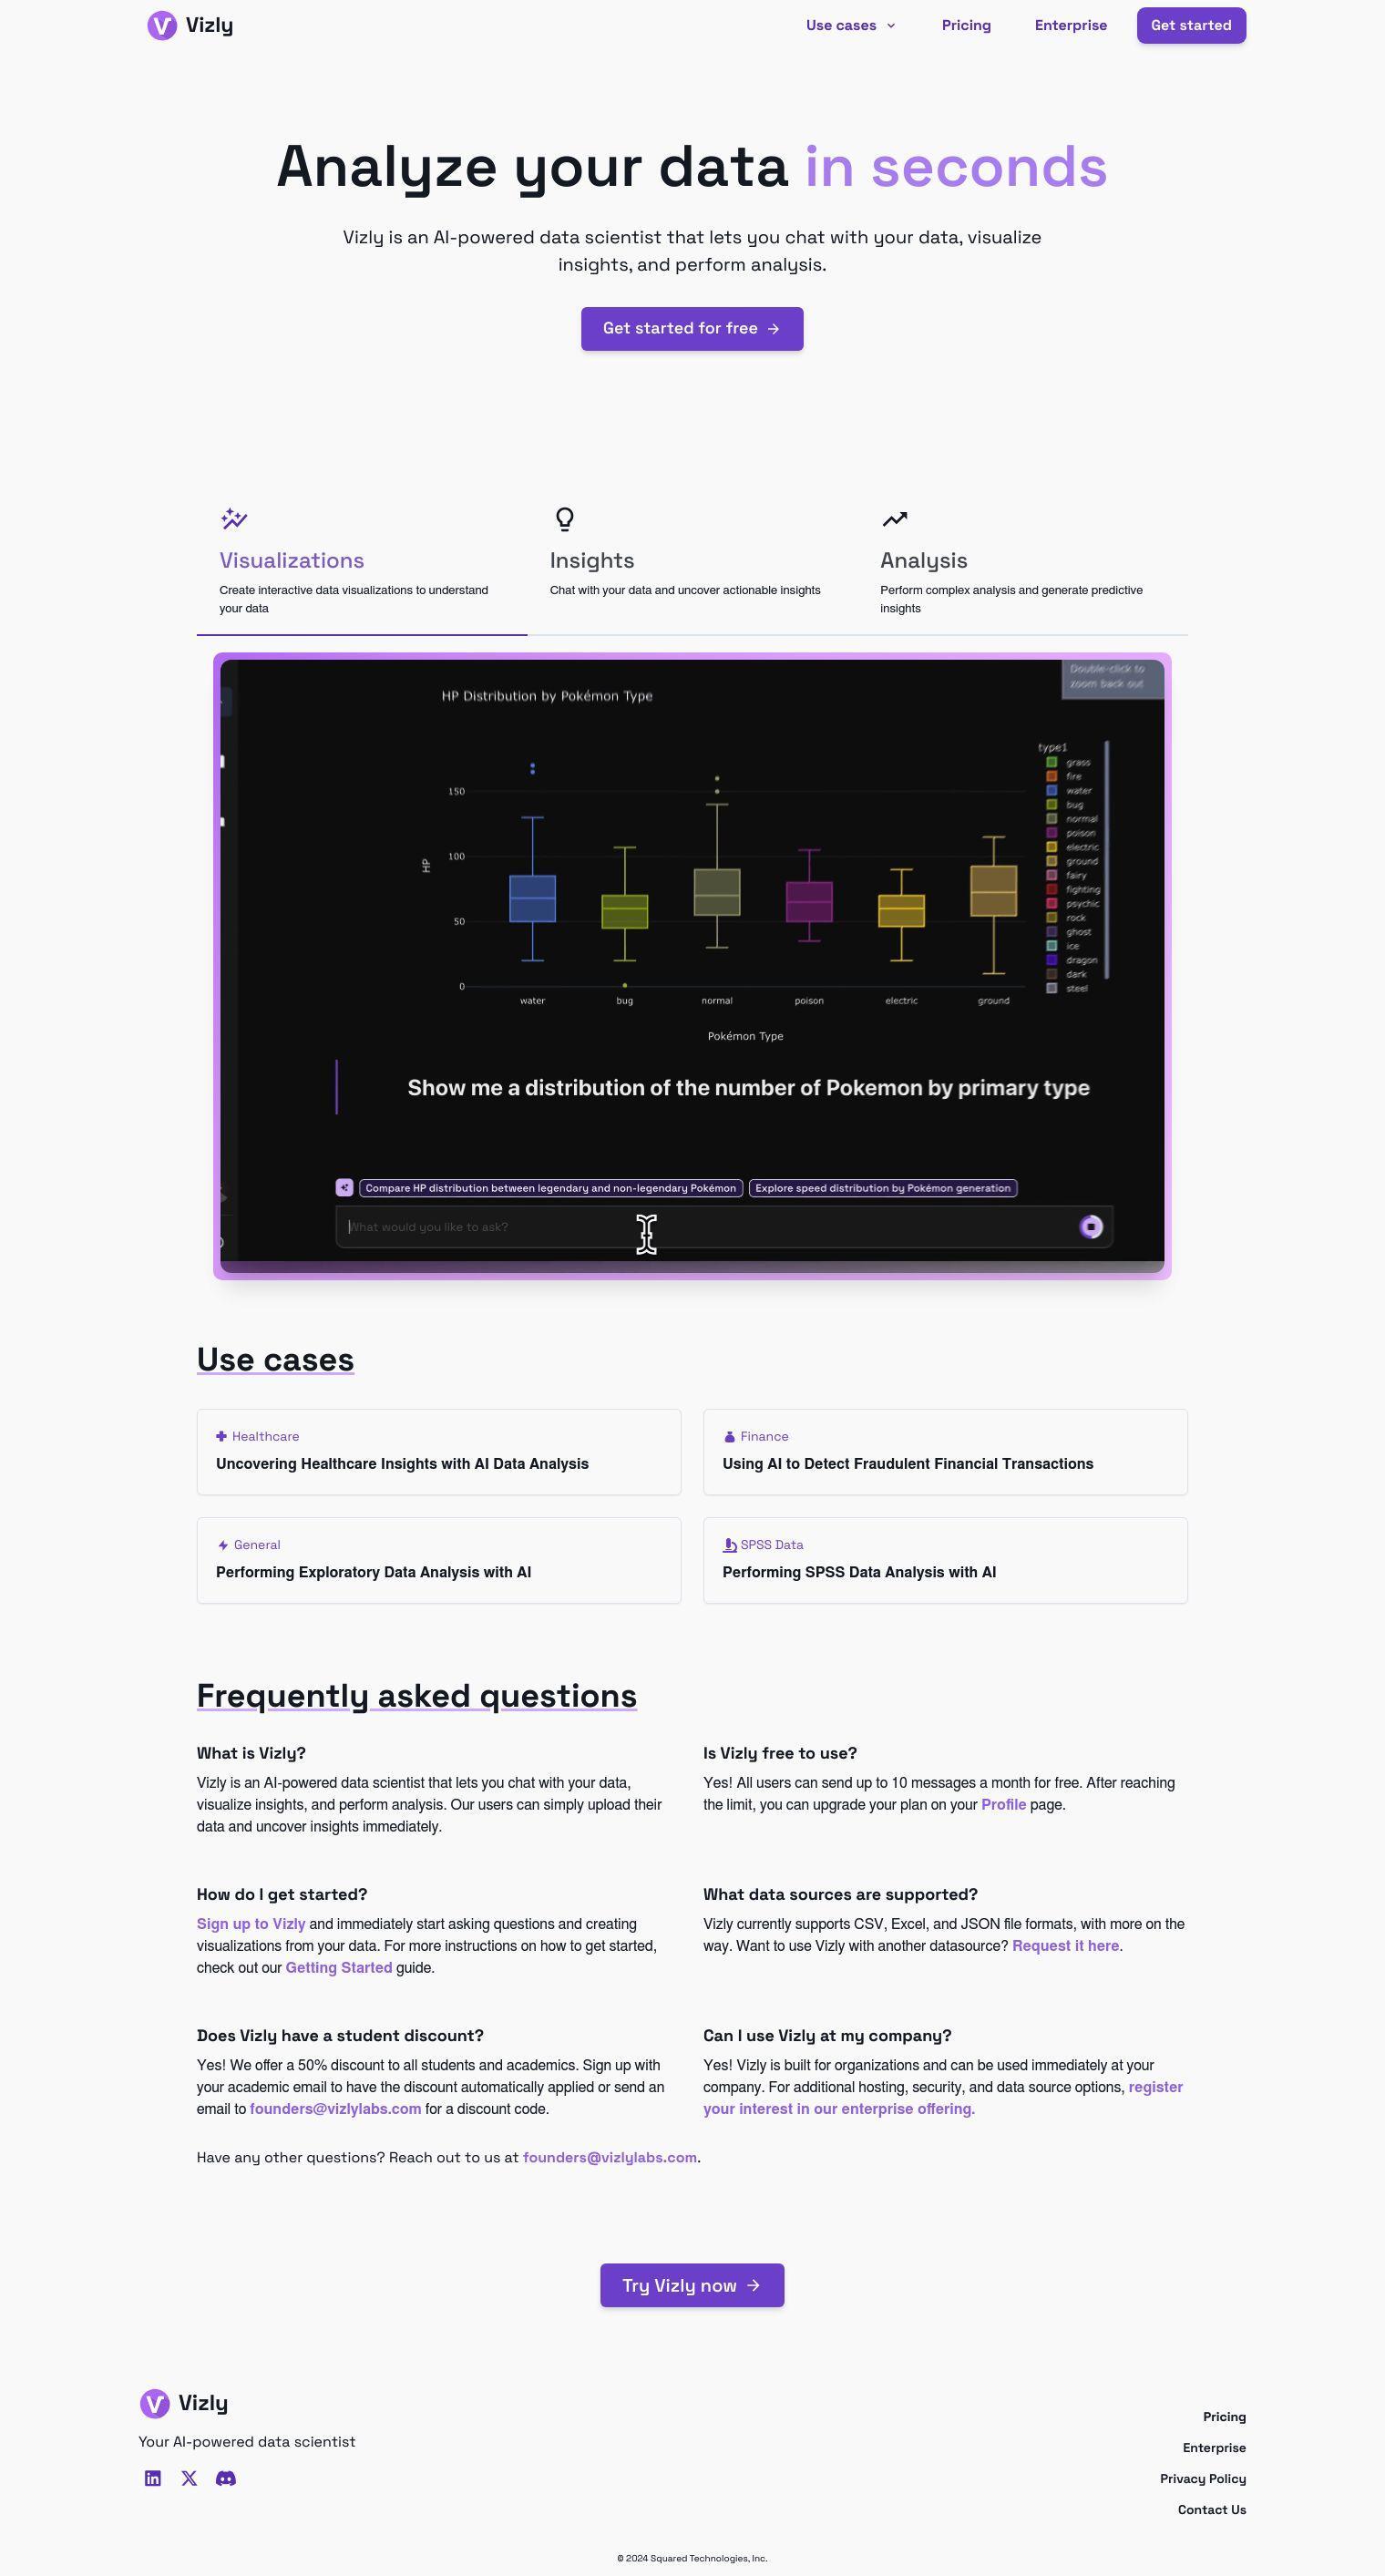
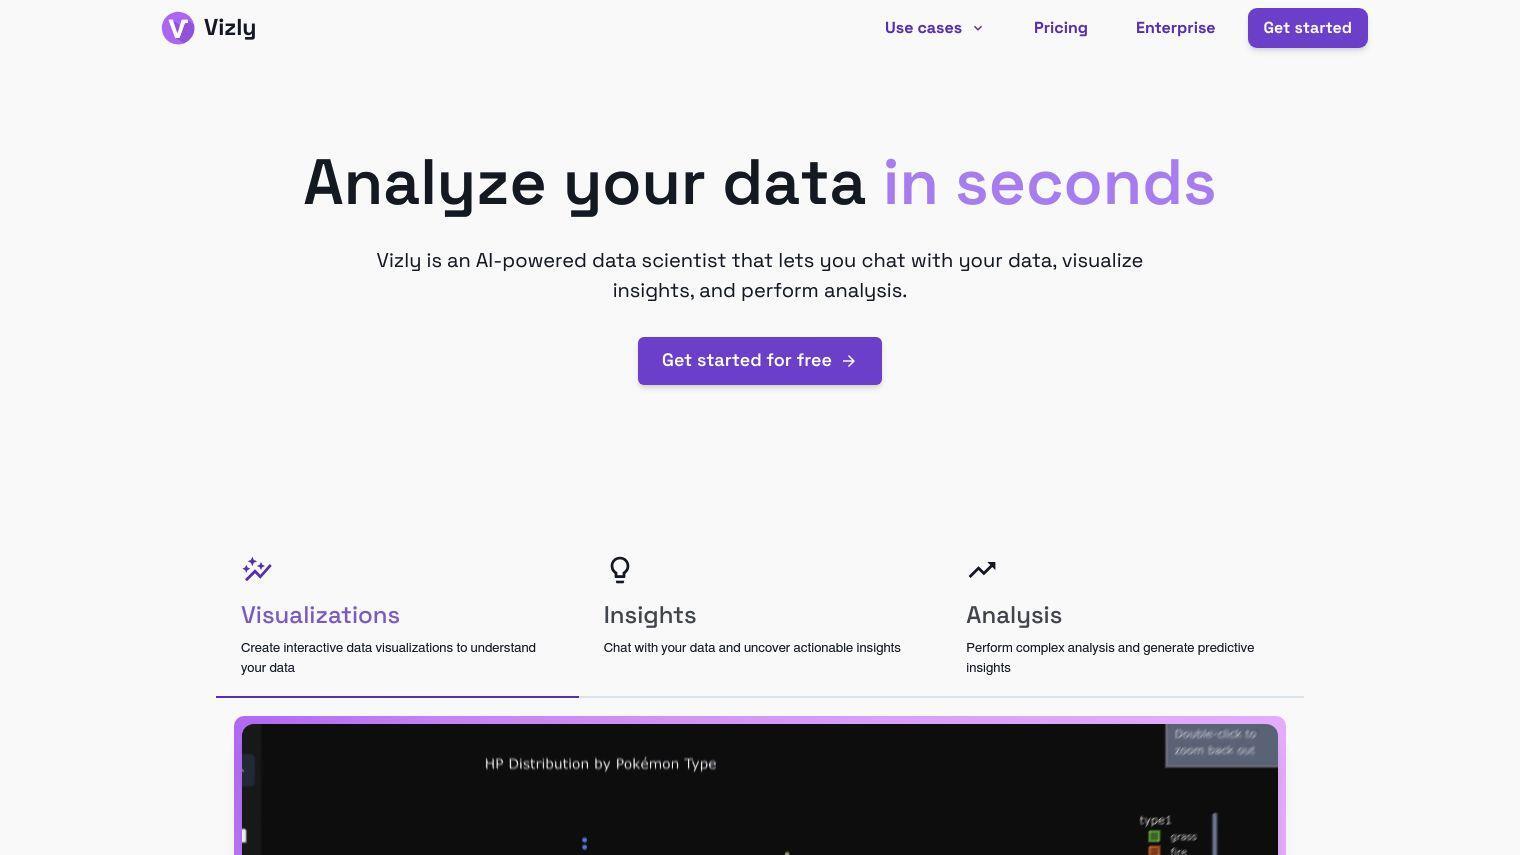
Vizly is an AI data scientist that lets you quickly and interactively analyze data. By letting you ask questions of your data, visualize results and perform advanced analysis, Vizly hopes to make data analysis easier.
Vizly can be used for a variety of use cases across different industries, including:
- Healthcare: Discovering health insights with AI data analysis.
- Finance: Discovering fraudulent financial transactions with AI.
- General: Performing exploratory data analysis with AI.
- SPSS Data: Analyzing SPSS data with AI.
Some of the key features of Vizly include:
- Interactive Data Visualizations: Create a variety of visualizations including bar charts, pie charts, line charts and scatter plots.
- Chat Interface: Ask questions and get answers from your data.
- Predictive Analysis: Perform advanced analysis and get predictive insights.
Vizly offers a free plan with up to 10 messages per month. For more usage, there are two paid plans:
- $25 per month: Up to 200 messages per month, accurate AI model, and support for CSV, XLSX, and JSON files.
- $33.33 per month: Unlimited messages, custom prompting and theming, and priority support.
Students and academics can get a 50% discount on these plans by signing up with their academic email or requesting a discount code. Vizly also has an enterprise plan for businesses, which can be explored by registering interest.
With the addition of AI abilities, Vizly makes data analysis more accessible and easier for individuals and businesses in a wide range of fields.
Published on June 13, 2024
Related Questions
Tool Suggestions
Analyzing Vizly...
