Question: I'm looking for a data visualization tool that can create interactive charts and graphs, do you know of any?
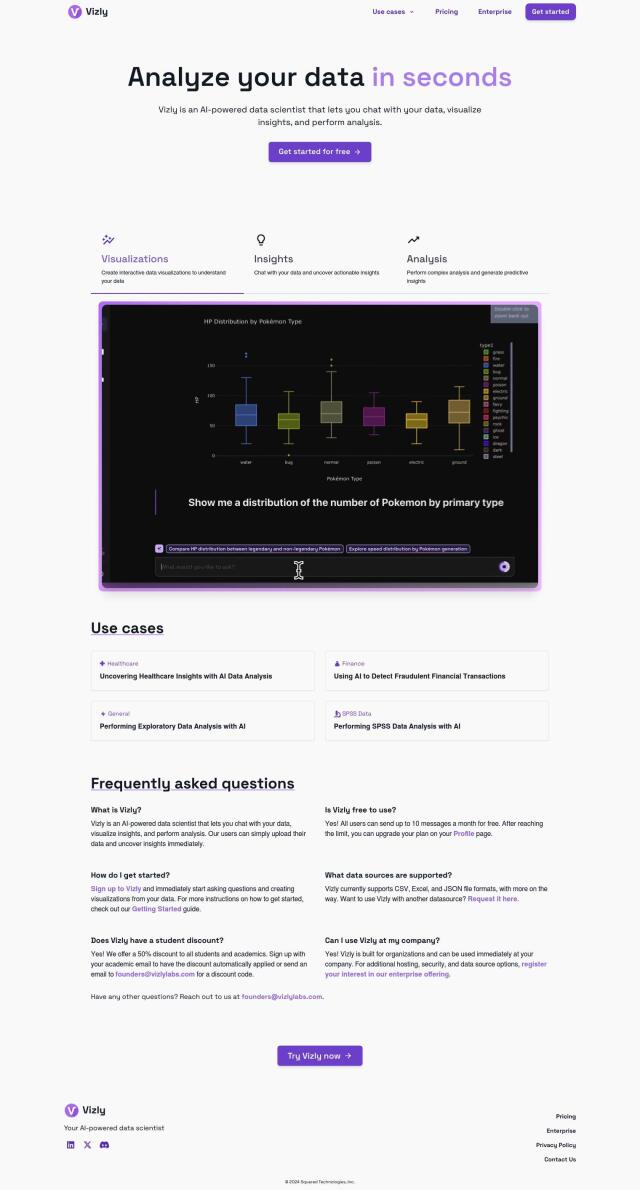
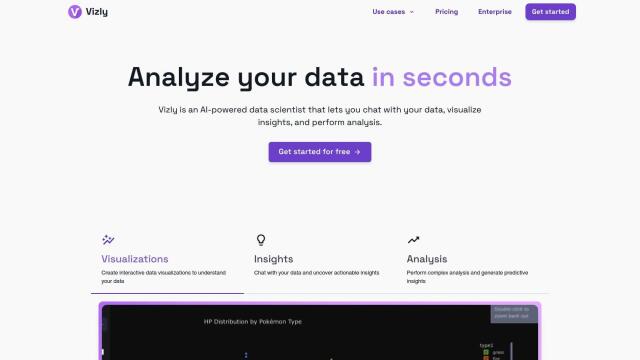
Vizly screenshot thumbnail

Vizly

If you need a data visualization tool that'll let you create interactive charts and graphs, Vizly is worth a close look. It's an AI interface that lets you rapidly and interactively explore data through a chat interface, which is good for use cases like medicine, finance and other areas. You can create different types of visualizations, including bar charts, pie charts, line charts and scatter plots, and even do some predictive analysis for further exploration.
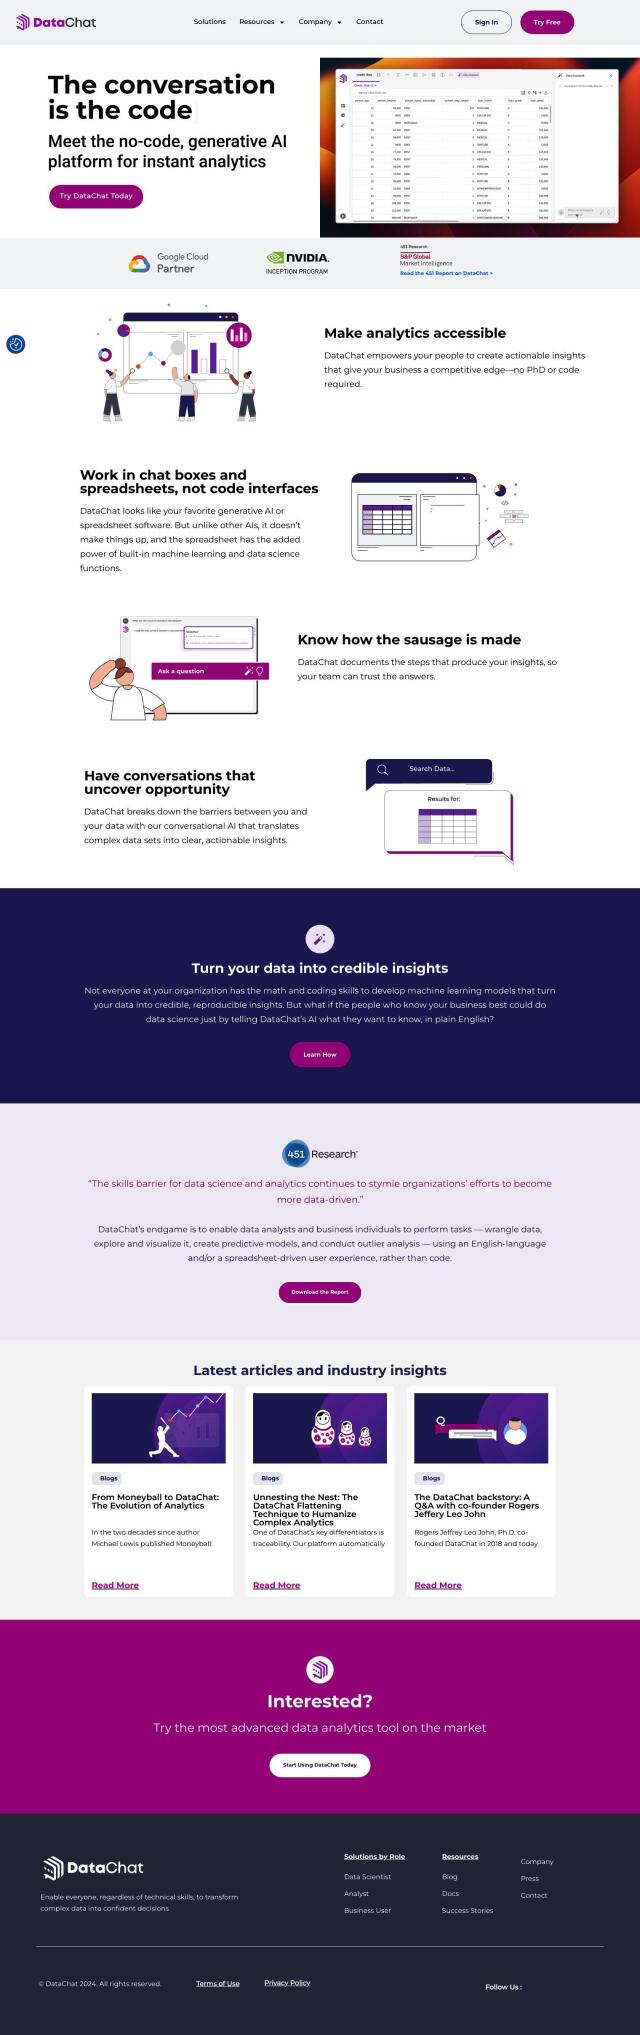
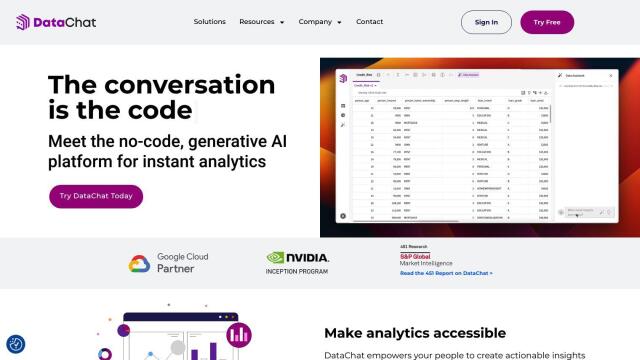
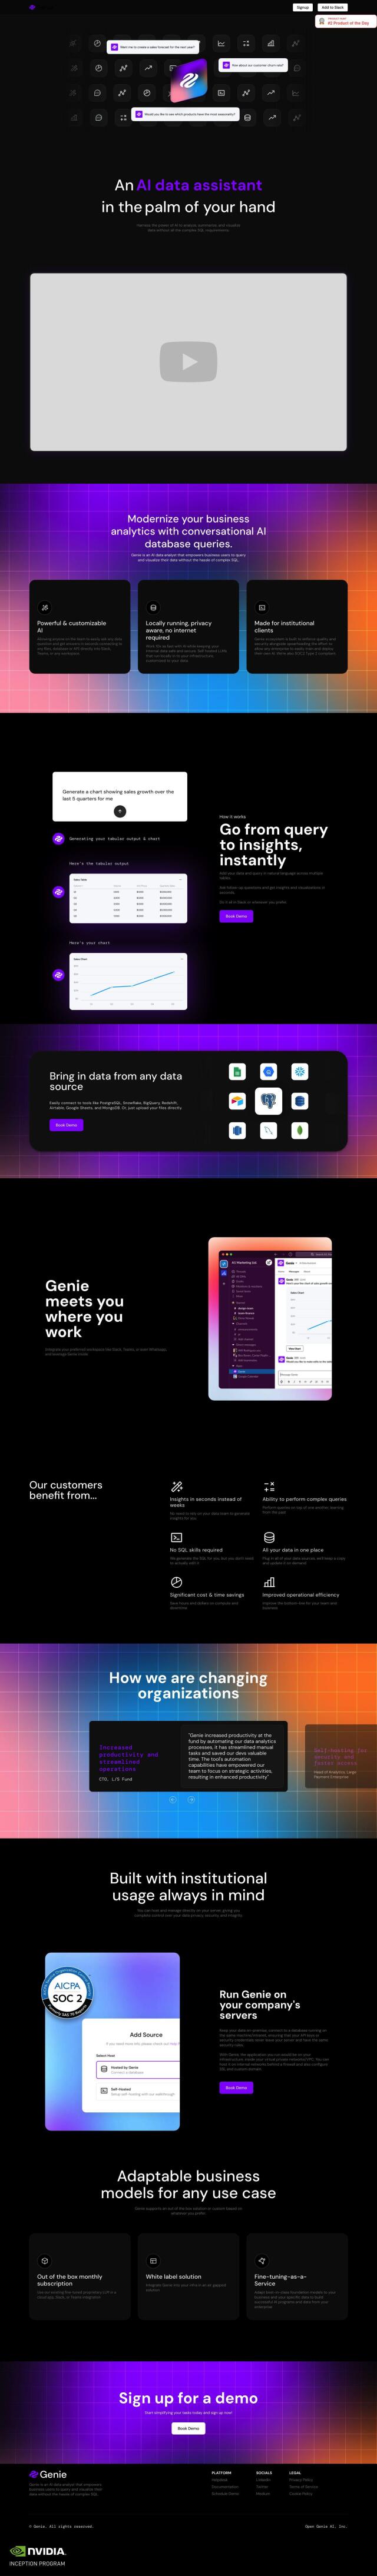
DataChat screenshot thumbnail

DataChat

Another good option is DataChat, a no-code generative AI interface that can transform raw data into useful information. It's got a spreadsheet-like interface and chat software interface so you can explore data without having to write any code. You can upload data, ask questions and get the AI's answer, which makes it good for data scientists, analysts and business people who need to make decisions fast and with confidence.
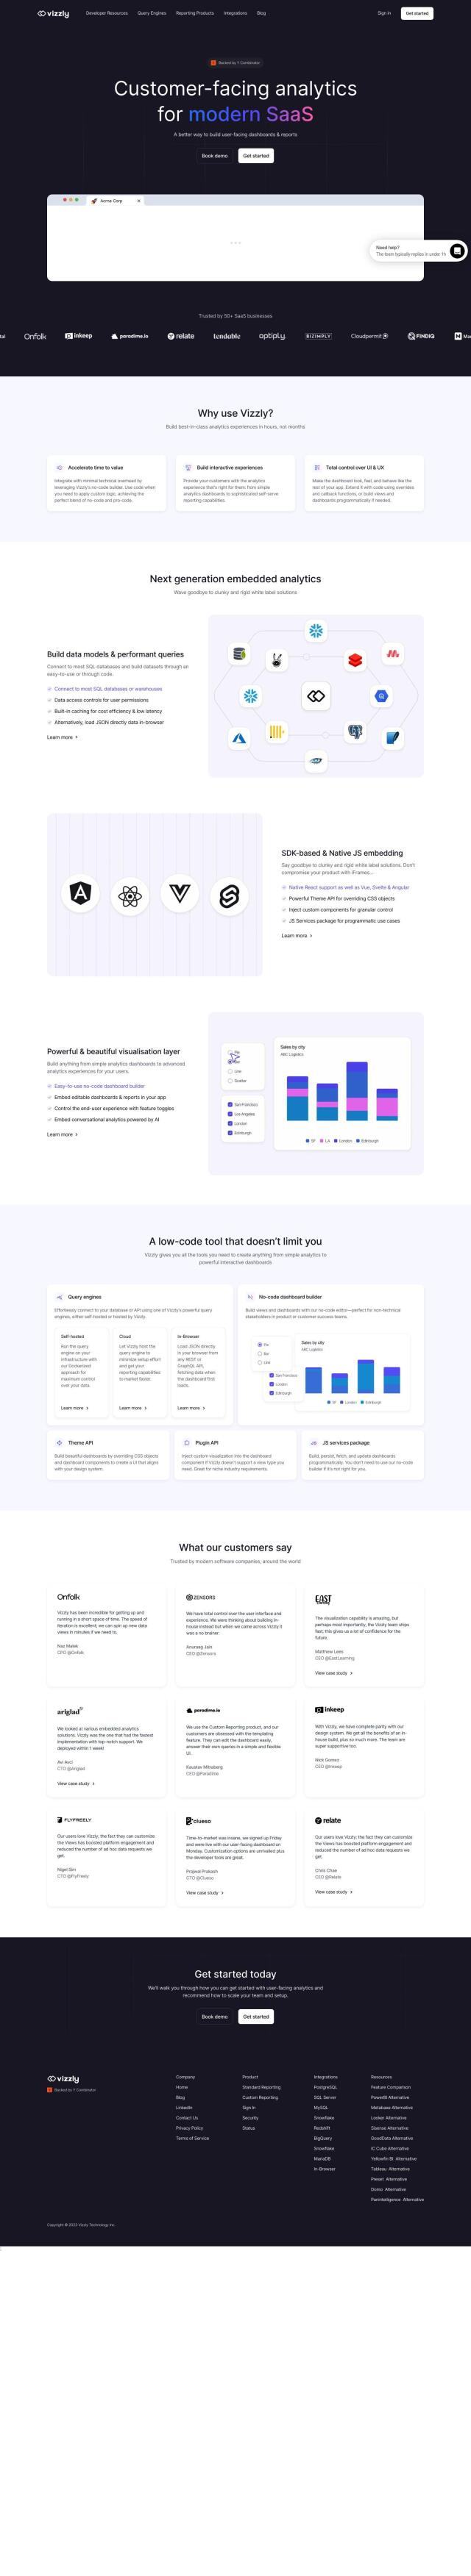
Vizzly screenshot thumbnail

Vizzly

If you're in the tech industry, Vizzly could be interesting. It's geared to help modern SaaS companies build, share and embed interactive analytics experiences with a minimal amount of technical work. With its no-code builder, customizable dashboards and native SDK-based embedding, Vizzly lets companies add analytics abilities quickly and engage customers without a lot of overhead.
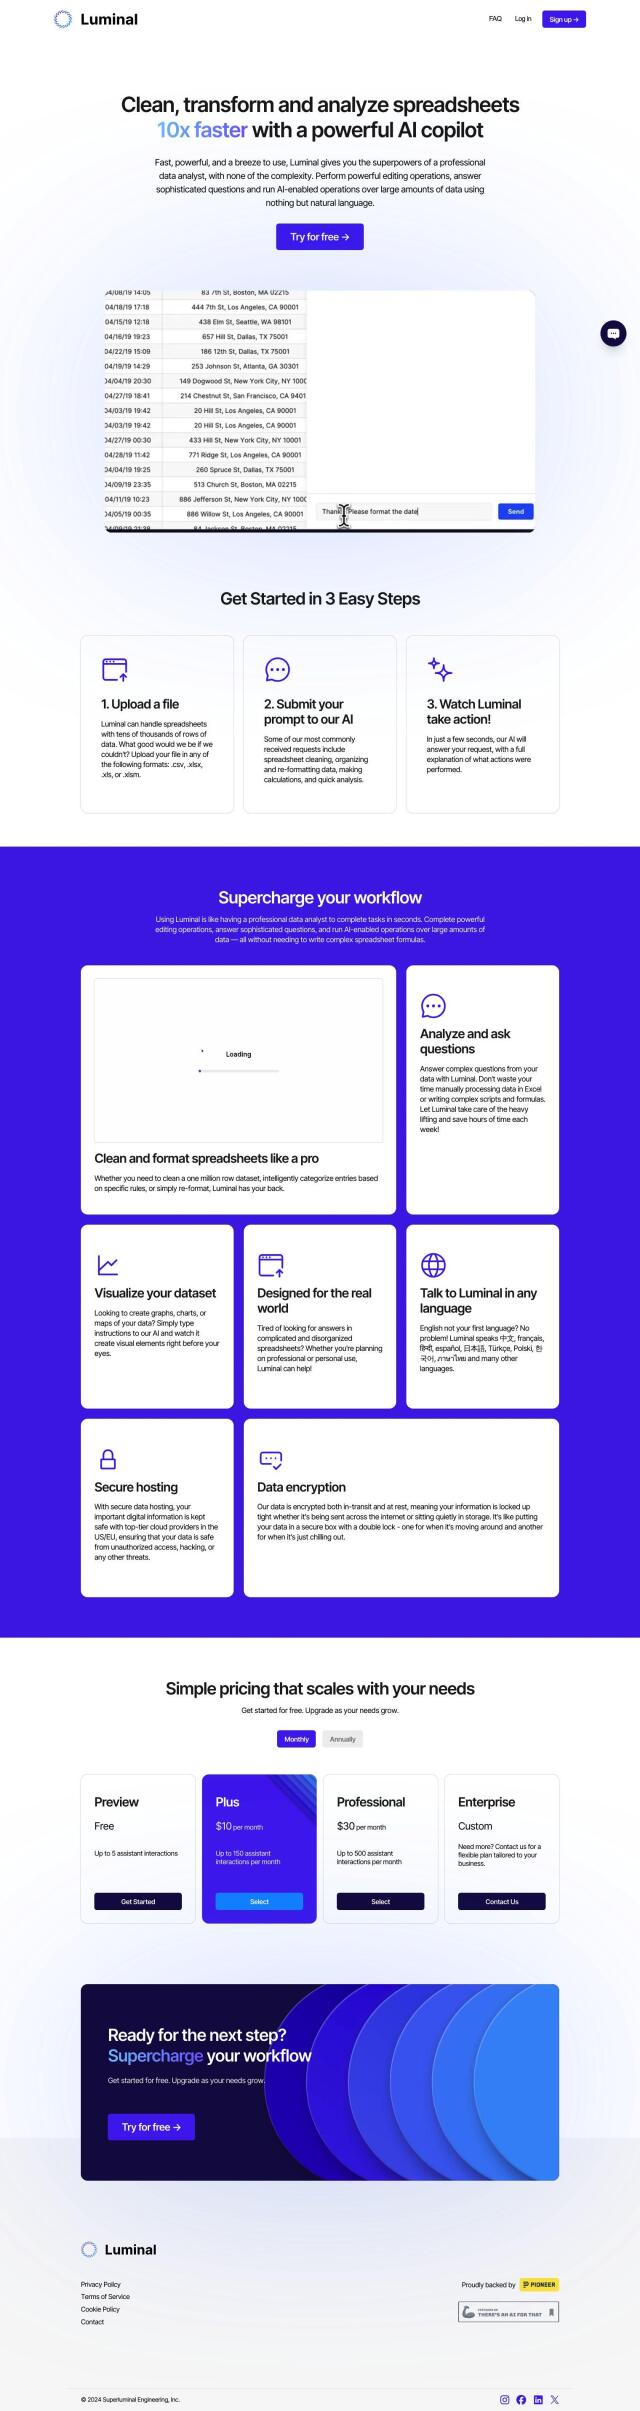
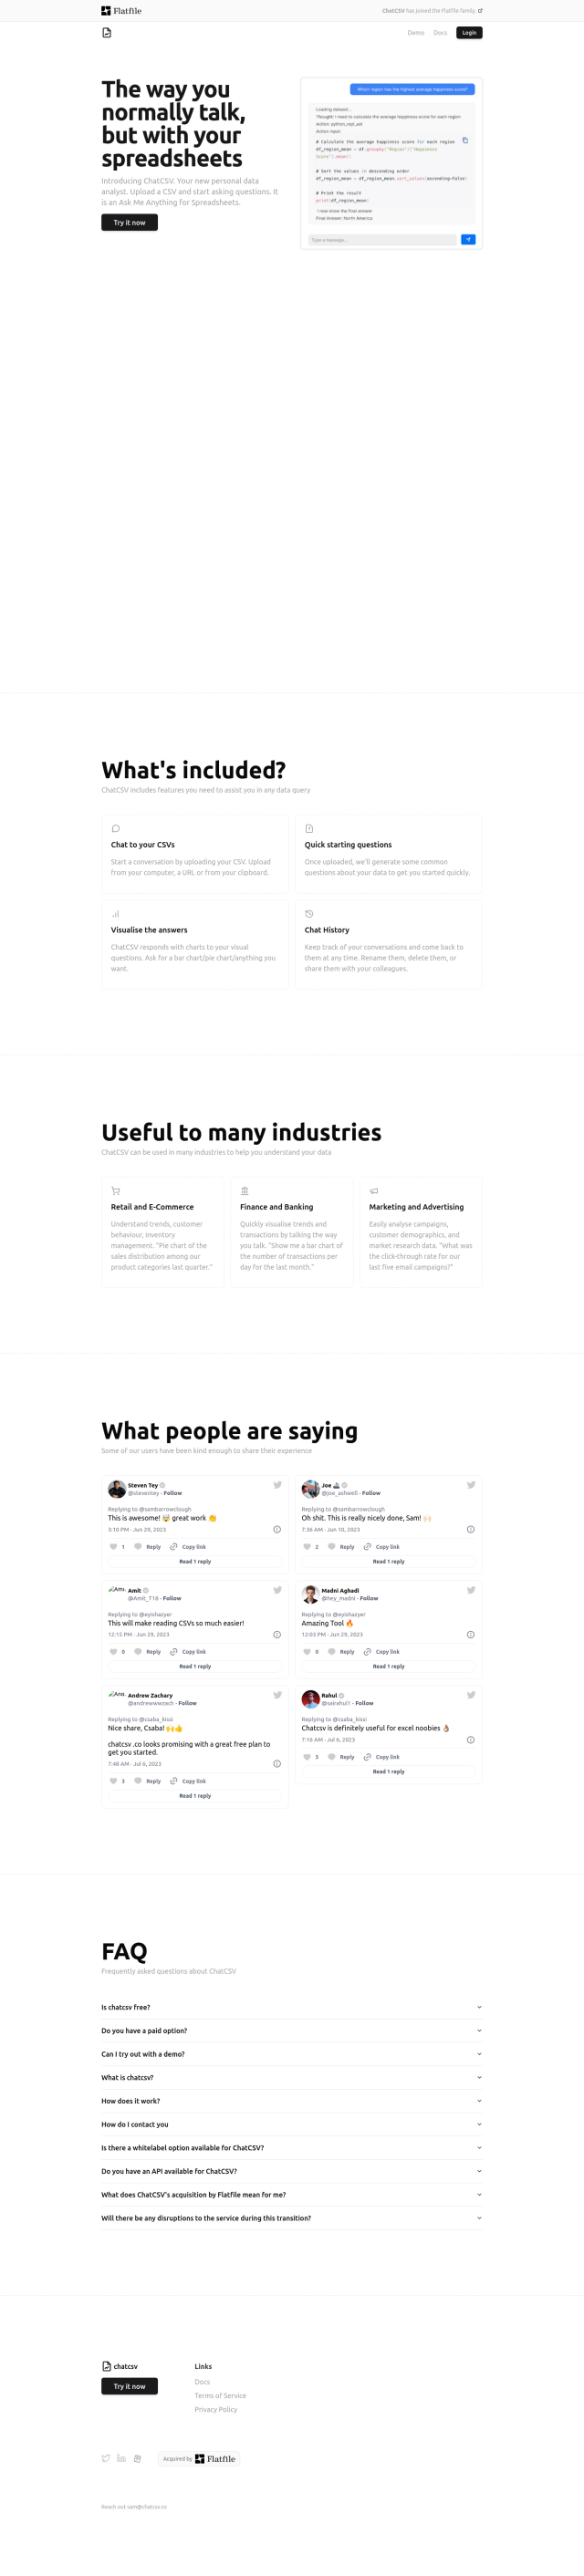
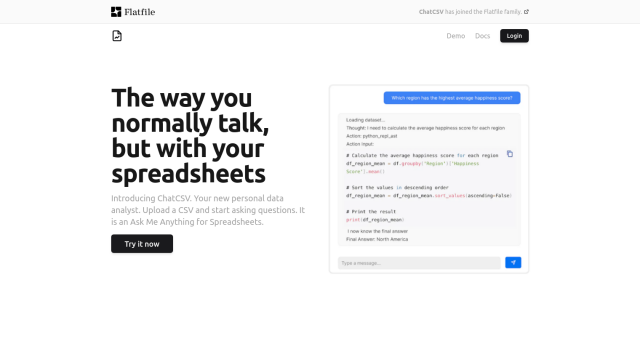
Luminal screenshot thumbnail

Luminal

Last, Luminal is an AI-powered spreadsheet management tool that can clean, transform and analyze data sets with high speed and efficiency. It offers a variety of data visualization options, including the ability to create graphs and charts with natural language prompts. Luminal is a good option for data pros who want to automate repetitive tasks and get insights quickly and securely.

Additional AI Projects

Graphy screenshot thumbnail

Graphy

Combine data from multiple sources into interactive, shareable reports in minutes, with AI-powered tools reducing creation time by 80%.

Onboard Email screenshot thumbnail

Onboard Email

Automatically segments customers, optimizes inbox placement, and composes personalized emails for every interaction, driving engagement and conversions.

Polymer screenshot thumbnail

Polymer

Converts complex data into intuitive, actionable visualizations, linking multiple sources and generating real-time insights with AI-driven analytics and suggested trends.

Genie screenshot thumbnail

Genie

Ask data questions in natural language and get instant answers and visualizations, without requiring complex SQL or technical expertise.

Tabula screenshot thumbnail

Tabula

Automate data workflows, standardize disparate sources, and gain real-time insights without coding, empowering data-driven decision-making across departments.

ChatCSV screenshot thumbnail

ChatCSV

Ask plain language questions about your CSV data and receive chart answers, with automated starting points and conversation history for easy analysis.

Rasgo screenshot thumbnail

Rasgo

Ask plain language questions and get instant, automated insights with 24/7 intelligent analysis, secured and customized with business context and visualizations.

Morph screenshot thumbnail

Morph

Ingests data from multiple sources, analyzes it, and exports results to the destination of your choice without needing to write any code.

Airbook screenshot thumbnail

Airbook

Accelerate data analysis and insights generation across teams with native connectors to 150+ data sources, collaborative querying, and visualization tools.

Formula Bot screenshot thumbnail

Formula Bot

Turns text into various outputs, including Excel formulas, SQL queries, and more, to accelerate data analysis and spreadsheet workflows.

Chartonomics screenshot thumbnail

Chartonomics

Convert any data into 20+ chart types with a single click, no setup required, for instant visualization and communication of complex ideas.

Athena screenshot thumbnail

Athena

Accelerate analytics workflows with an AI-native platform that learns your workflow, automates tasks, and enables collaborative data analysis with natural language interaction.

Patterns screenshot thumbnail

Patterns

Ask a question, get an answer in seconds, without manual data analysis, using AI-powered SQL, charts, and explanations.

Findly screenshot thumbnail

Findly

Ask business data questions in English, and get instant insights, visualizations, and scheduled reports, empowering collaborative and data-driven decision-making.

SimplyPut screenshot thumbnail

SimplyPut

Ask data questions in plain language and get trusted answers without coding, with real-time analytics and AI-powered insights into trends, anomalies, and forecasts.

Explo screenshot thumbnail

Explo

Embed interactive dashboards and self-serve reporting directly into products, enabling end-users to customize analytics experiences and make better decisions.

ANDRE screenshot thumbnail

ANDRE

Automates survey data analysis, transforming raw data into clear insights and stories with professional slide decks and strategic guidance.

ChatDB screenshot thumbnail

ChatDB

Query your database using natural language, with AI generating the necessary SQL, and create engaging charts for quick business insights.

Baresquare screenshot thumbnail

Baresquare

Detects anomalies 24/7, automates root cause analysis, and prioritizes actions based on business impact, empowering teams to take swift, data-driven decisions.

AITable screenshot thumbnail

AITable

Streamline workflow automation with a visual database, connecting to over 6,000 apps, and automate repetitive tasks with customizable forms and AI-driven content generation.