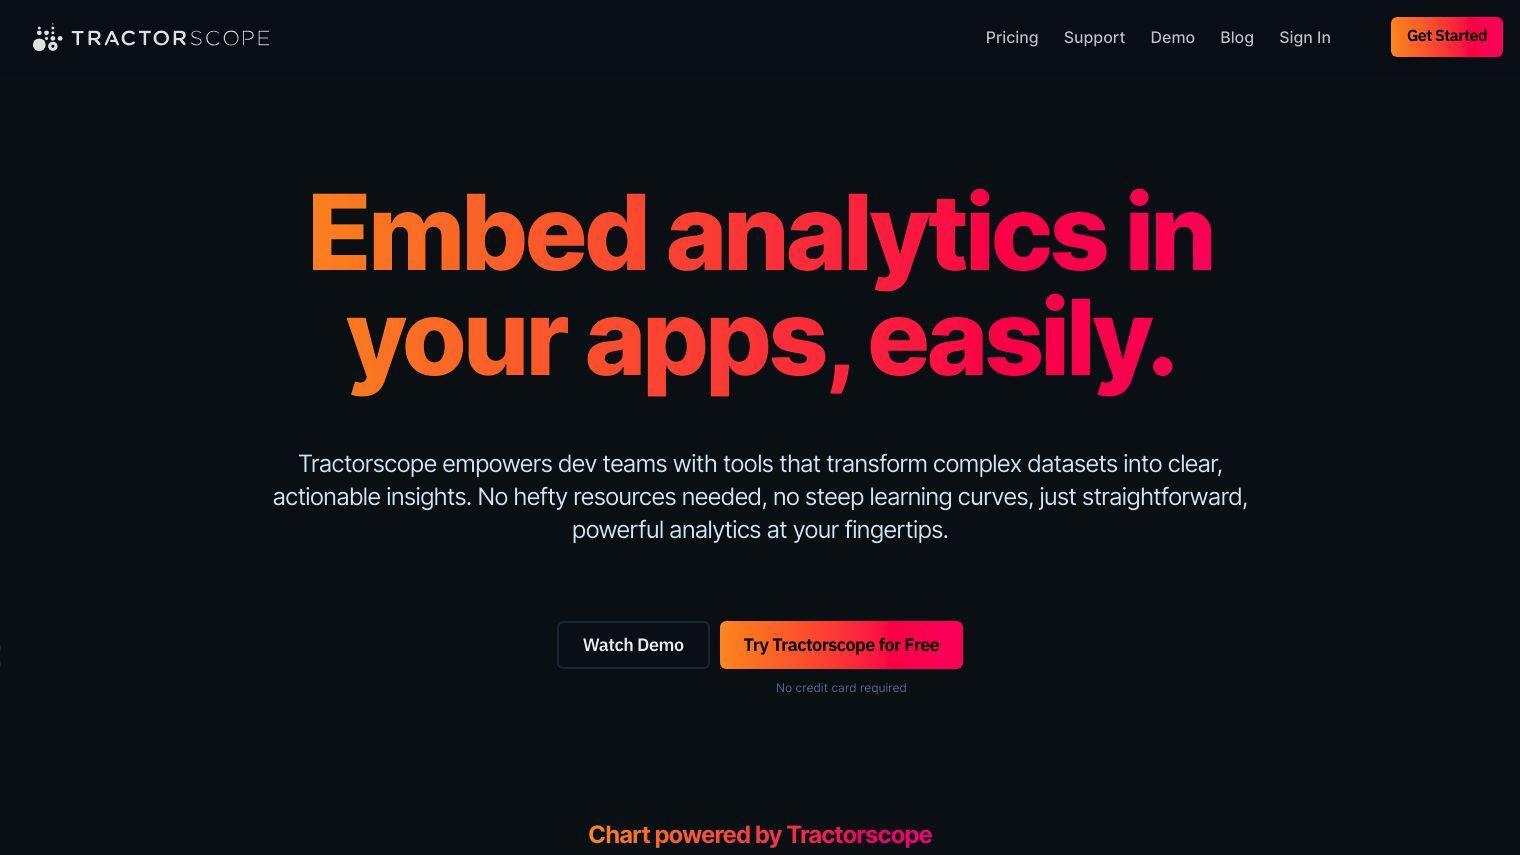
Tractorscope gives developers the ability to turn complex data into meaningful insights with tools to query, customize and embed data dashboards and charts into their apps. The company wants to make data visualization easy, not requiring a lot of resources and a big learning curve.
Some of its features include the ability to:
- Connect to different data sources: MySQL, PostgreSQL, MongoDB, Google BigQuery and more.
- Set up queries: AI Assist, Schema Browser, SQL Auto Complete and Data View.
- Design as needed: Edit chart types, colors and layouts.
- Embed and share: Public or private URLs, direct linking, email notifications and scheduled reports.
Tractorscope is designed for fintech, ecommerce and health care, among other areas, where real-time reporting and analytics can improve operations. Companies can benefit from:
- Lower costs: Substantial cost savings through efficient data visualization.
- Better decision-making: Faster, more informed business decisions with data insights.
- Better customer value: Better analytics and reporting for customers.
The company offers several pricing tiers:
- Lite: $9 per month (1 user, 1 dashboard, 10 charts, 100MB cache, 1GB transfer)
- Plus: $149 per month (5 users, 10 dashboards, 100 charts, 5GB cache, 50GB transfer)
- Team: $349 per month (15 users, 75 dashboards, 1500 charts, 10GB cache, 100GB transfer)
- Business: $750 per month (30 users, 250 dashboards, 3500 charts, 100GB cache, 1000GB transfer)
Tractorscope offers flexible charting, a SQL editor and smart dashboards with drag-and-drop tools to control layout and design. For enterprise customers, the company offers custom plans that can be negotiated.
Tractorscope's mission is to help small and medium-size businesses get more value out of their databases by making it easier to create and display meaningful insights. By making data visualization easier, developers and businesses can concentrate on growth and more intelligent decision-making.
Published on July 2, 2024
Related Questions
Tool Suggestions
Analyzing Tractorscope...


