Question: I need a solution that allows me to create interactive charts and reports without requiring extensive coding knowledge or resources.
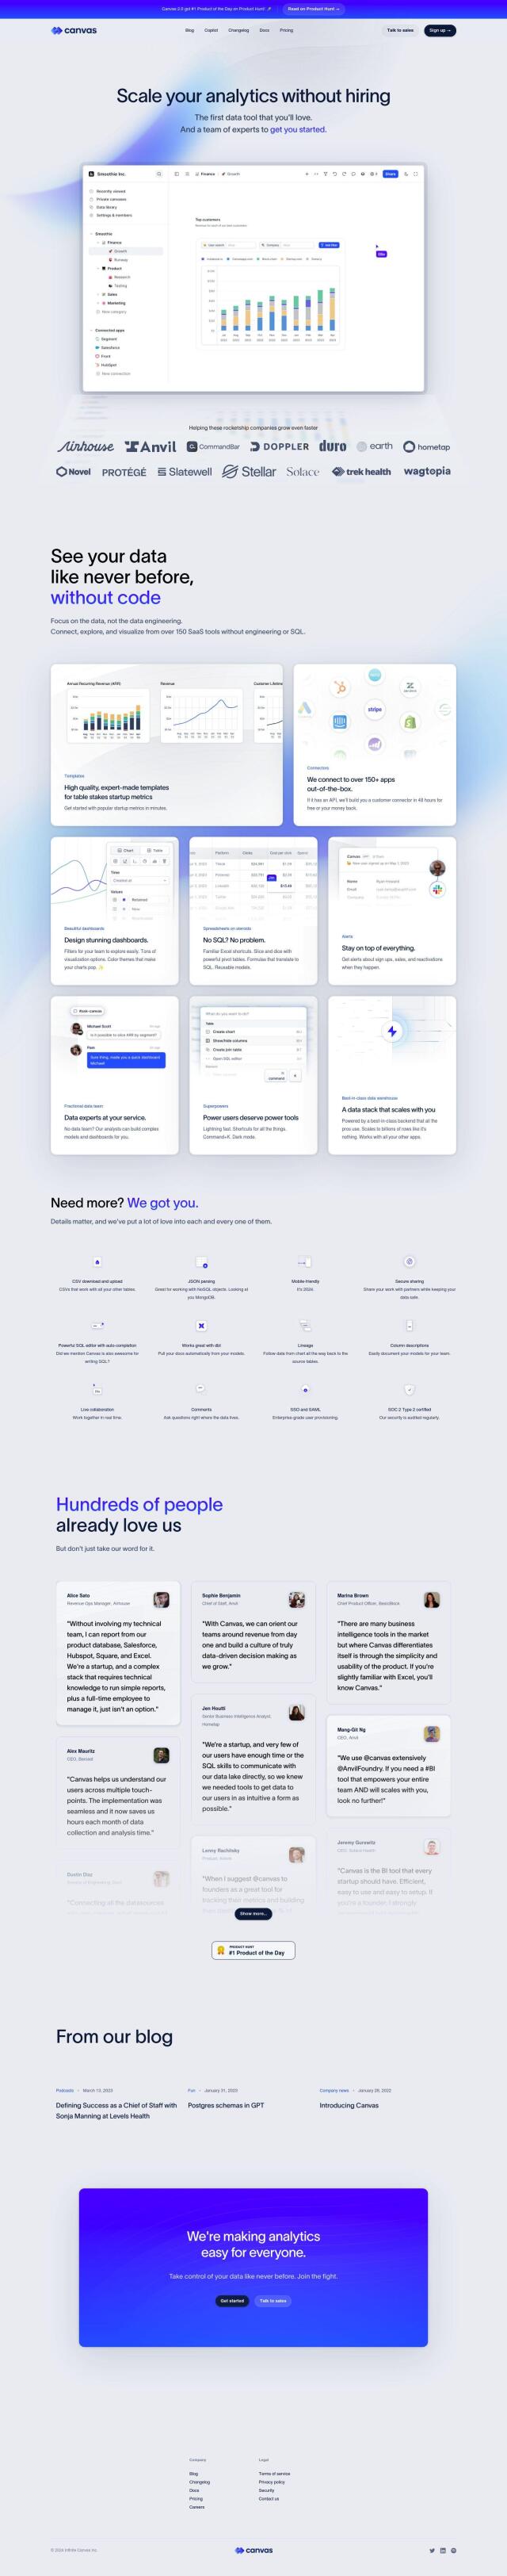
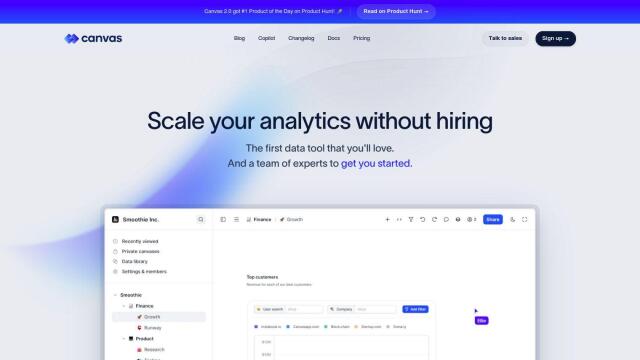
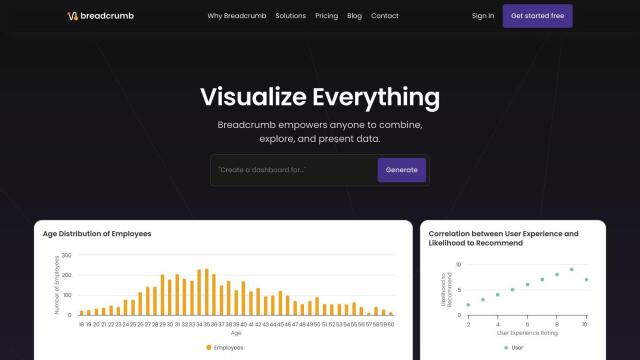
Onvo screenshot thumbnail

Onvo

One of the top options is Onvo. Onvo is an AI-powered data visualization tool that lets you build interactive charts and insights without having to write complex queries or fiddle with data. It connects to a variety of data sources, lets you build dashboards with simple AI prompts, and offers customization options to match your brand. Onvo also connects to sources like MongoDB, PostgreSQL, Google Sheets and Salesforce, so it's good for startups and enterprises.
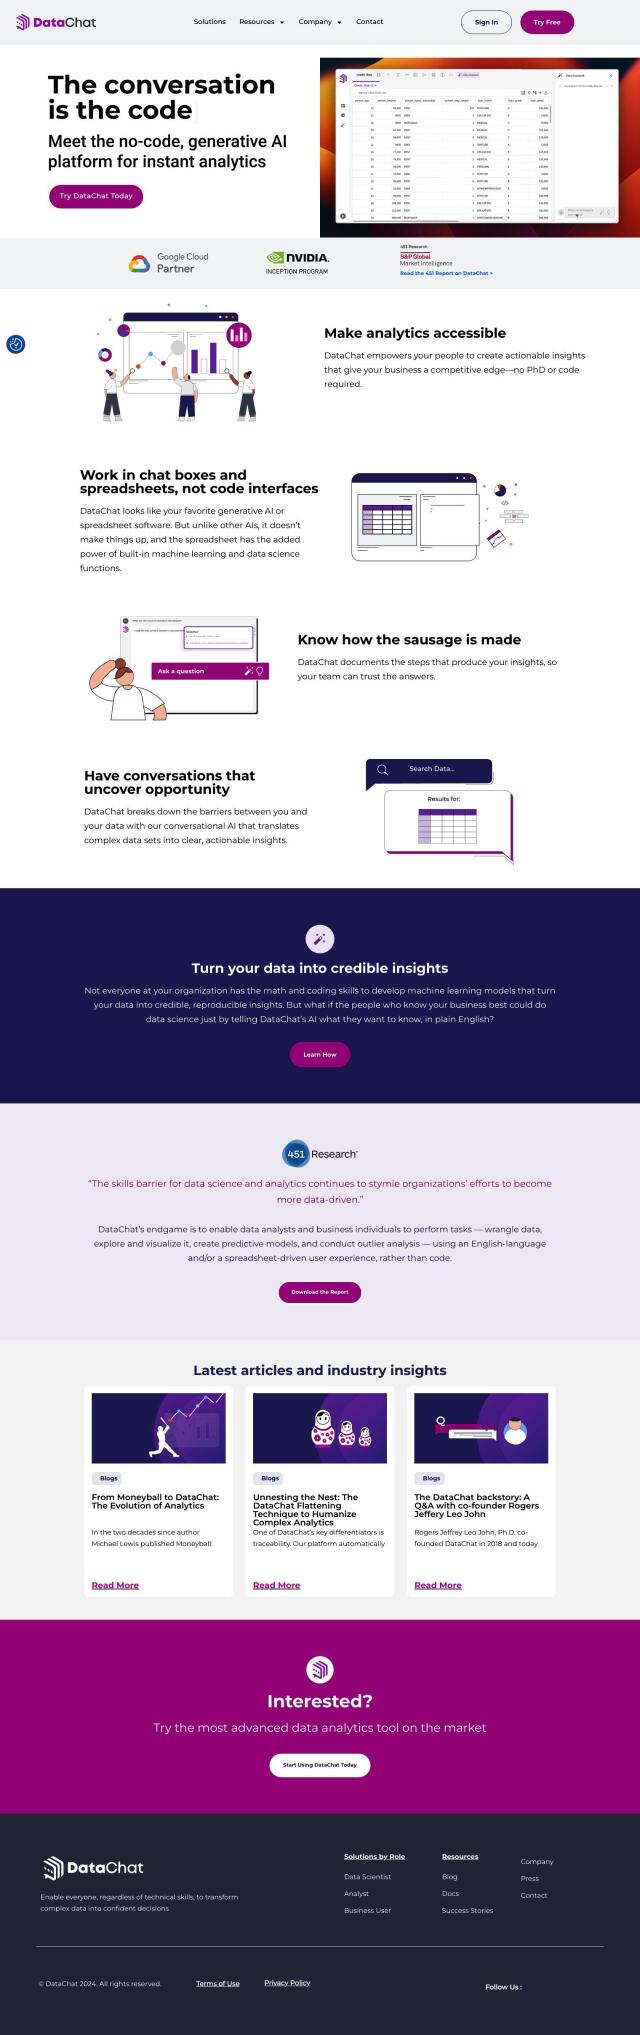
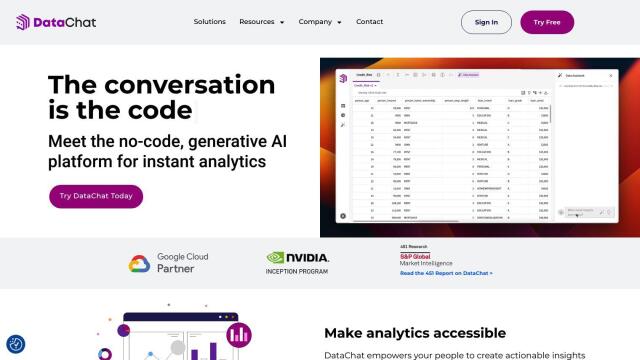
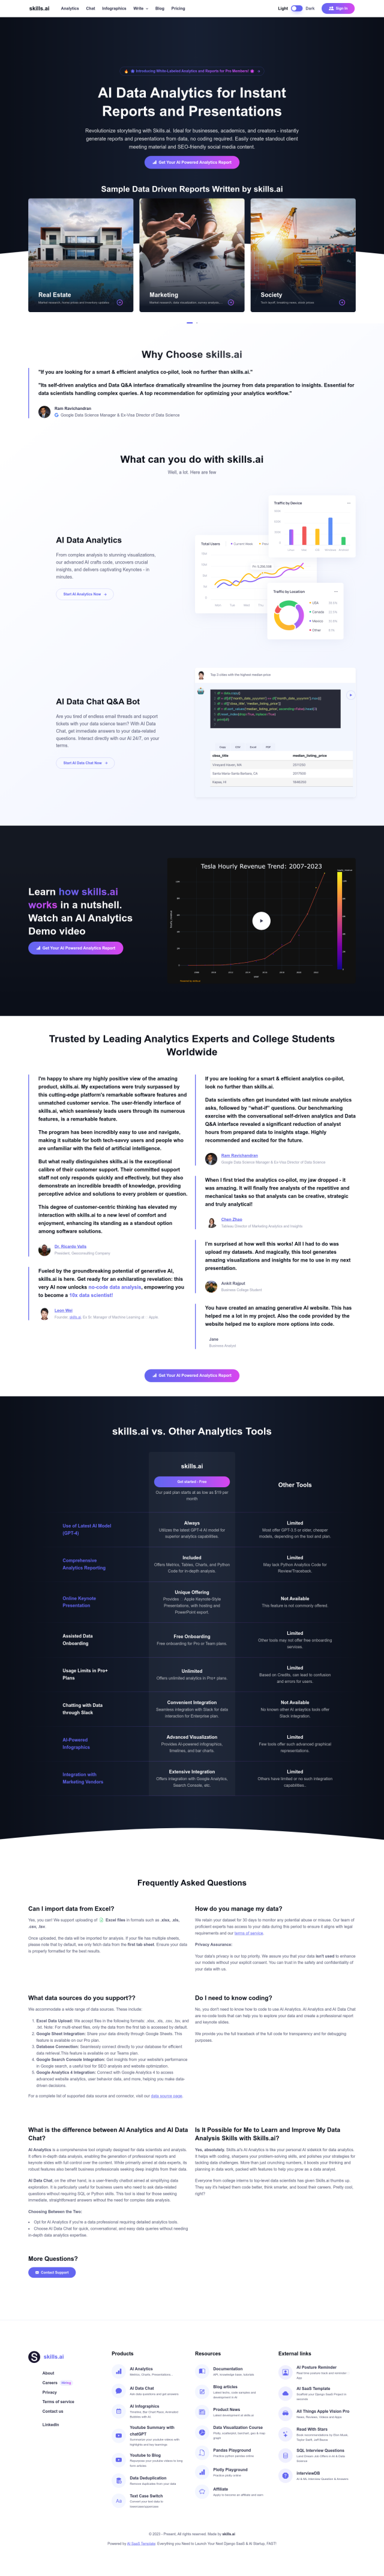
DataChat screenshot thumbnail

DataChat

Another top no-code option is DataChat. It's a generative AI platform with a user interface that looks like a familiar spreadsheet and chat interface. You can upload data, ask questions, and get AI-generated answers without any programming skills. DataChat automates data preparation, exploration and modeling, which makes it a good choice for data scientists, analysts and business users who need to make quick decisions with confidence.
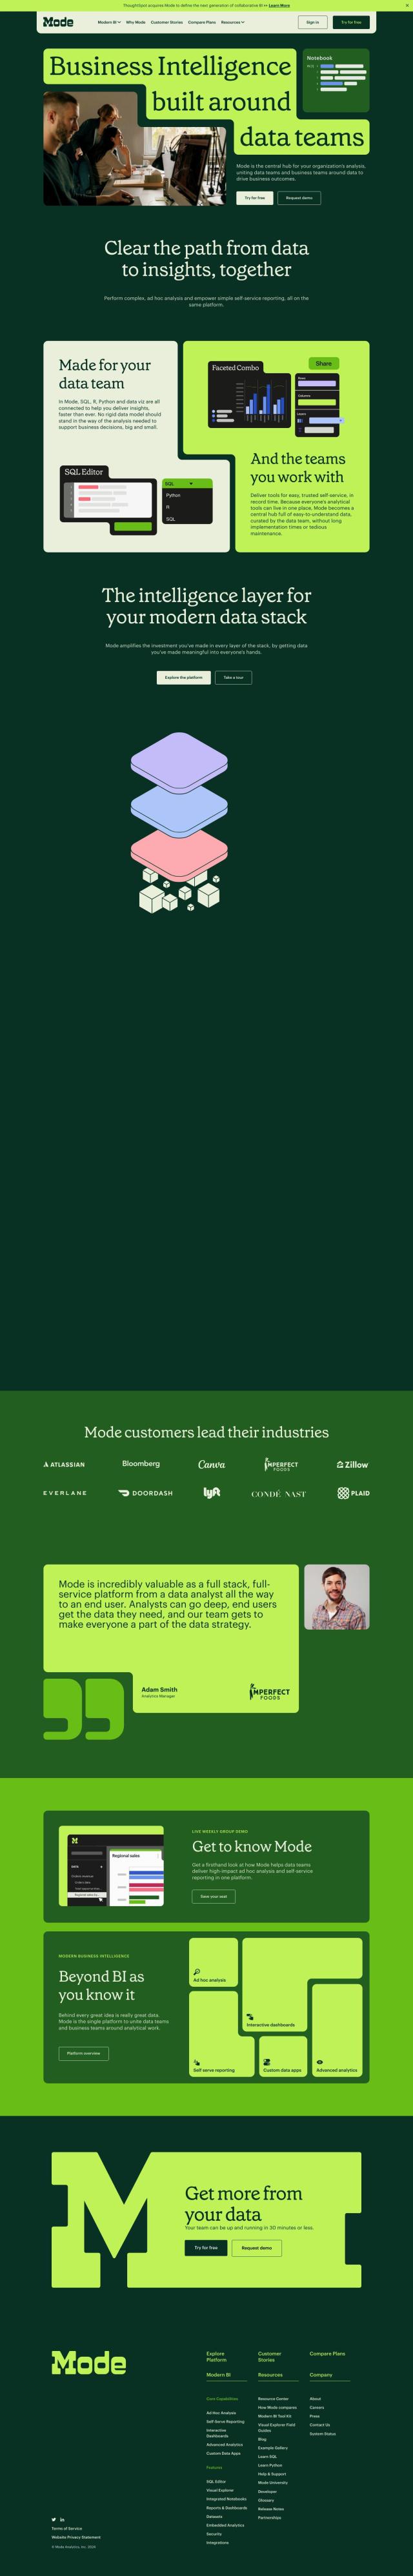
Graphy screenshot thumbnail

Graphy

If you want a flexible tool, Graphy is worth a look. Graphy combines data from tools like Google Analytics and LinkedIn Ads so you can build interactive reports in minutes with AI-powered productivity. It offers customizable visualizations and a flexible pricing plan, including a free tier. Graphy is good for data-driven marketers and teams that want to simplify reporting and share insights.

Additional AI Projects

GoodData screenshot thumbnail

GoodData

Quickly build custom data products with interactive analytics abilities, leveraging AI-powered features like a no-code interface and chat assistant for effortless insights.

Tabula screenshot thumbnail

Tabula

Automate data workflows, standardize disparate sources, and gain real-time insights without coding, empowering data-driven decision-making across departments.

Vizzly screenshot thumbnail

Vizzly

Build and share interactive, customizable analytics experiences with a no-code dashboard builder, empowering users to explore data without technical hassle.

Canvas screenshot thumbnail

Canvas

Link, query, and visualize data from 150+ SaaS tools without coding, empowering non-technical teams to make data-informed decisions.

Skills.ai screenshot thumbnail

Skills.ai

Generate data-infused articles, reports, and presentations without coding, leveraging AI-driven analytics to turn data into actionable insights in minutes.

Polymer screenshot thumbnail

Polymer

Converts complex data into intuitive, actionable visualizations, linking multiple sources and generating real-time insights with AI-driven analytics and suggested trends.

Mode screenshot thumbnail

Mode

Unify data analysis and visualization with SQL, R, Python, and interactive dashboards to accelerate insights and collaboration across teams.

ChartAI screenshot thumbnail

ChartAI

Generate various charts and diagrams, including pie charts, flowcharts, and mind maps, from entire data sets with a user-friendly, ChatGPT-like interface.

Image Charts screenshot thumbnail

Image Charts

Automatically create custom charts from data, including line, pie, and scatter charts, with branding and embedding options for seamless integration.

Spreadsheet.com screenshot thumbnail

Spreadsheet.com

Combines spreadsheet interface with automation, customizable views, and integrations to streamline project management, data tracking, and team collaboration.

Zing Data screenshot thumbnail

Zing Data

Get answers to data questions in seconds, without expertise, using intuitive natural language querying and automated data modeling.

Blaze SQL screenshot thumbnail

Blaze SQL

Ask a question, get instant data insights with automated SQL queries, charts, and dashboards, no coding required.

Chartonomics screenshot thumbnail

Chartonomics

Convert any data into 20+ chart types with a single click, no setup required, for instant visualization and communication of complex ideas.

Breadcrumb screenshot thumbnail

Breadcrumb

Transform data into interactive AI dashboards, connecting multiple sources, and track trends in real-time with 100% accurate visualizations and natural language queries.

Explo screenshot thumbnail

Explo

Embed interactive dashboards and self-serve reporting directly into products, enabling end-users to customize analytics experiences and make better decisions.

Decipad screenshot thumbnail

Decipad

Combine data, formulas, and text into interactive notebooks, bridging the gap between analysis and storytelling with easy-to-understand models and real-time data updates.

Hex screenshot thumbnail

Hex

Unify data teams with AI-assisted exploration, collaboration, and interactive reporting, accelerating data work and improving accuracy in a single, modular workspace.

Embeddable screenshot thumbnail

Embeddable

Craft compelling customer-facing analytics experiences and embed them directly into your application, with full control and flexibility, in a fraction of the time.

Jeda.ai screenshot thumbnail

Jeda.ai

Collaborative, interactive canvas for creating, visualizing, and analyzing data, turning ideas into beautiful visuals and insights with advanced generative AI capabilities.

Ajelix screenshot thumbnail

Ajelix

Automate tasks, create formulas, and build dashboards with ease using AI-powered spreadsheet tools and a self-service BI platform.

eqtble screenshot thumbnail

eqtble

Centralizes people data from various sources, enabling analysts to create data-driven stories and collaborate with others to drive informed decision-making.