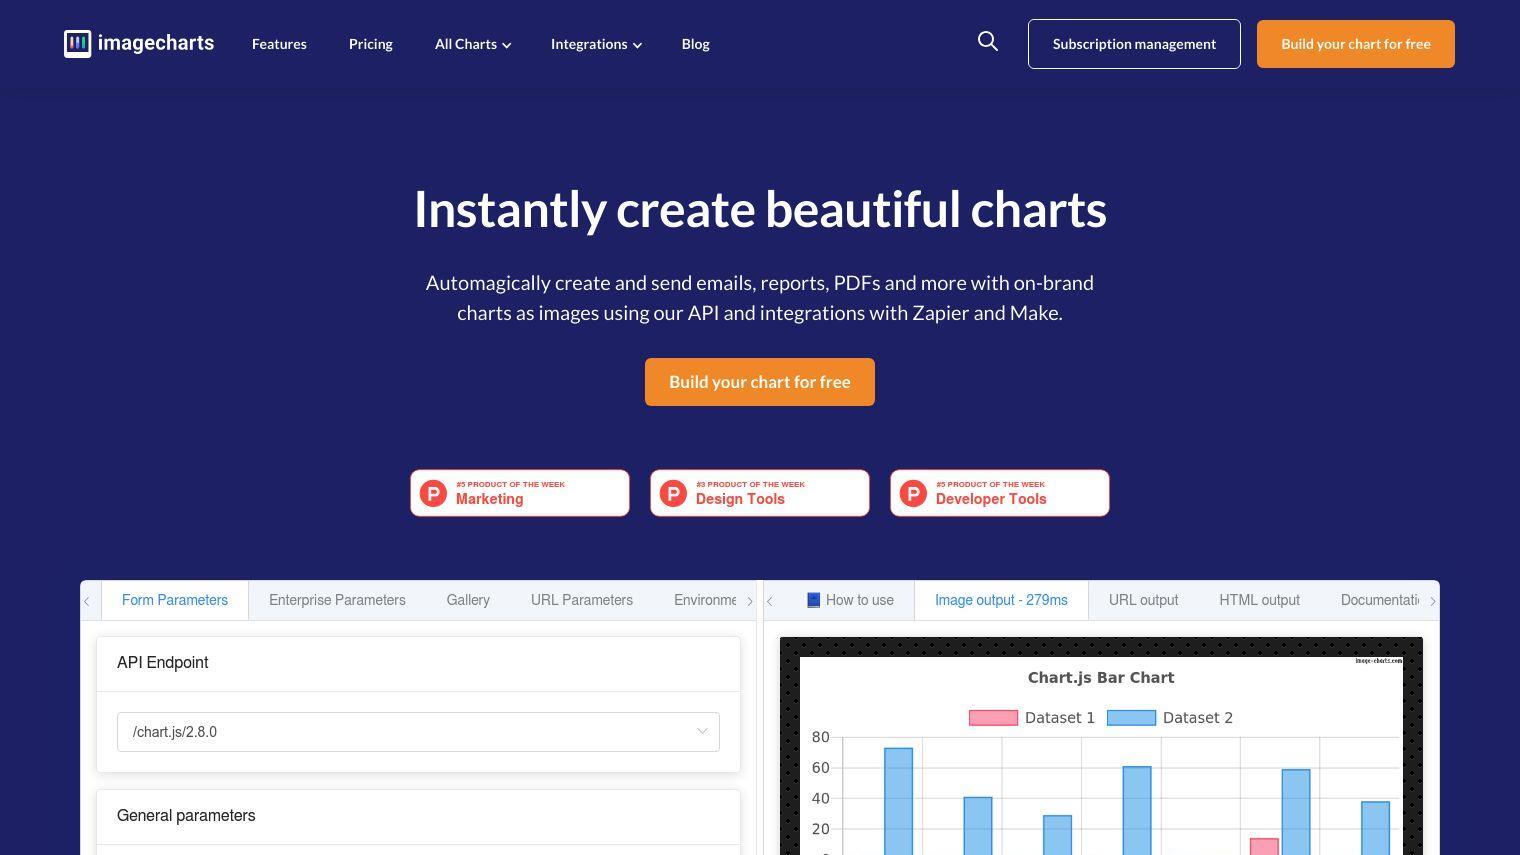
Image Charts is designed to automatically create charts from data, a useful way to share visualizations in emails, reports and other documents. The service also can be used with popular integration tools Zapier and Make to create no-code automated workflows that incorporate data from other tools you already use.
With Image Charts, you can create a variety of chart types, including line, pie, scatter and radar charts. You can customize charts with your own branding and embed charts with unique URLs. The service also offers a high degree of chart customization, including multiple axes, background images and high-resolution output.
Image Charts can be used with a variety of tools, including Google Drive, Google Forms, Google Sheets, Dropbox and Pipedrive, through Zapier and Make. That means you can use automated workflows to create charts based on data in those tools.
Pricing tiers include:
- Individual: Free, with manual data input for basic charts with a watermark.
- Business: $99 per month (annual billing), with no watermark, custom subdomain, Zapier and Make integration and priority email support.
- Enterprise: $249 per month (annual billing), with all Business plan features plus a dedicated support contact, high-resolution chart support and compound charts with multiple axes.
If you want to spice up your email reports, automate chart creation or just make your data more presentable, Image Charts is a useful and relatively easy service to use.
Published on June 14, 2024
Related Questions
Tool Suggestions
Analyzing Image Charts...


