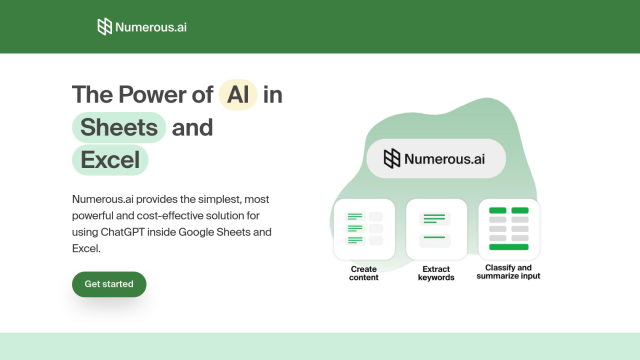
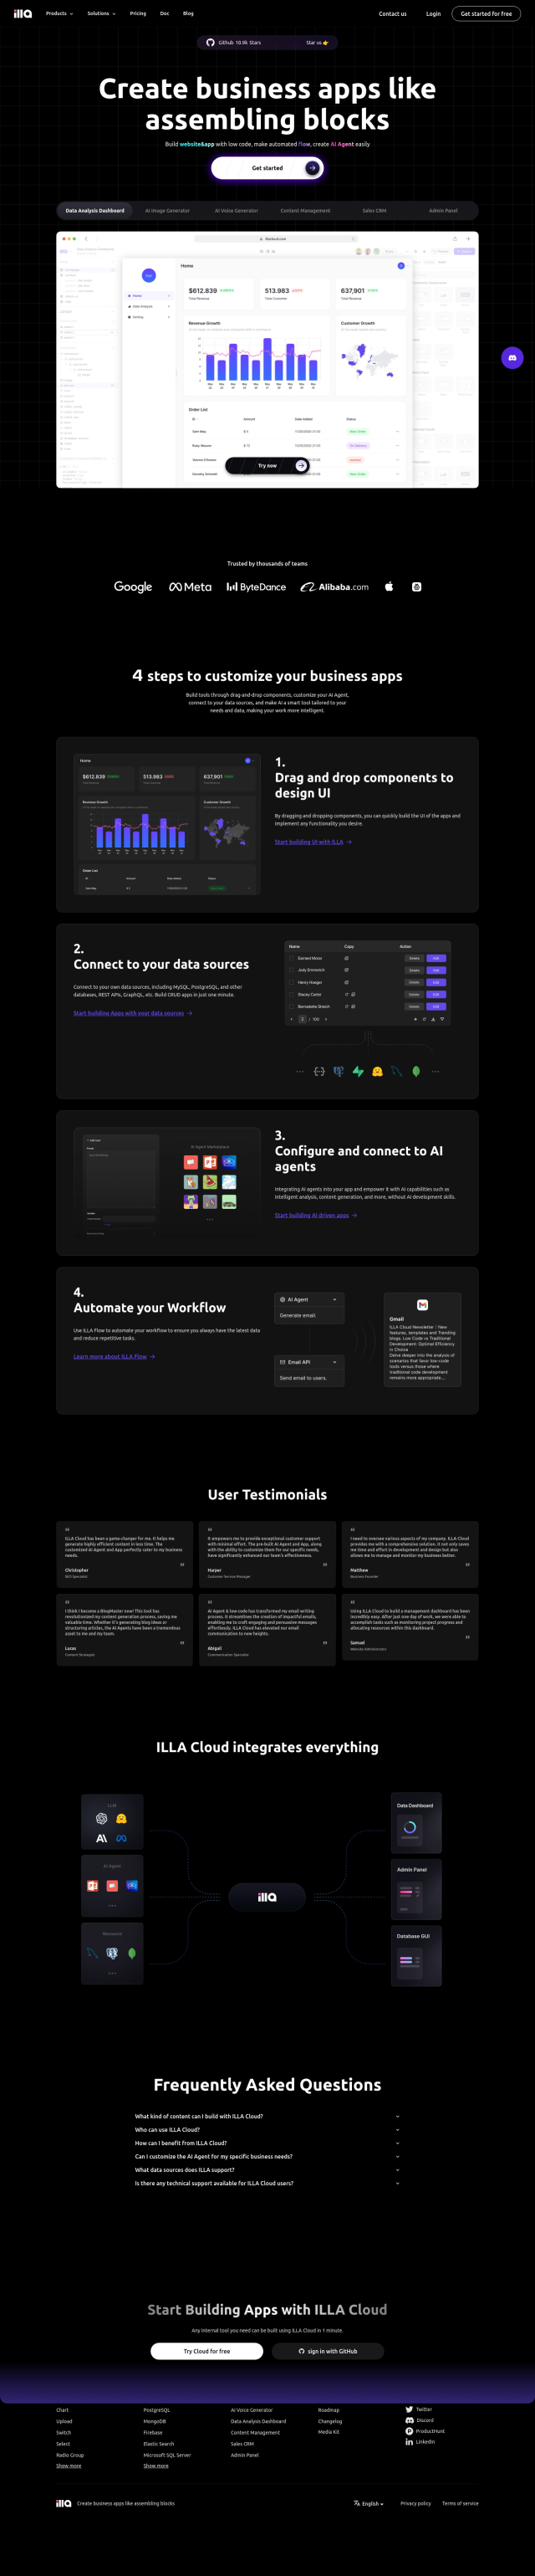
Question: I need a service that integrates with Google Drive and Google Sheets to create visualizations, do you know of any?
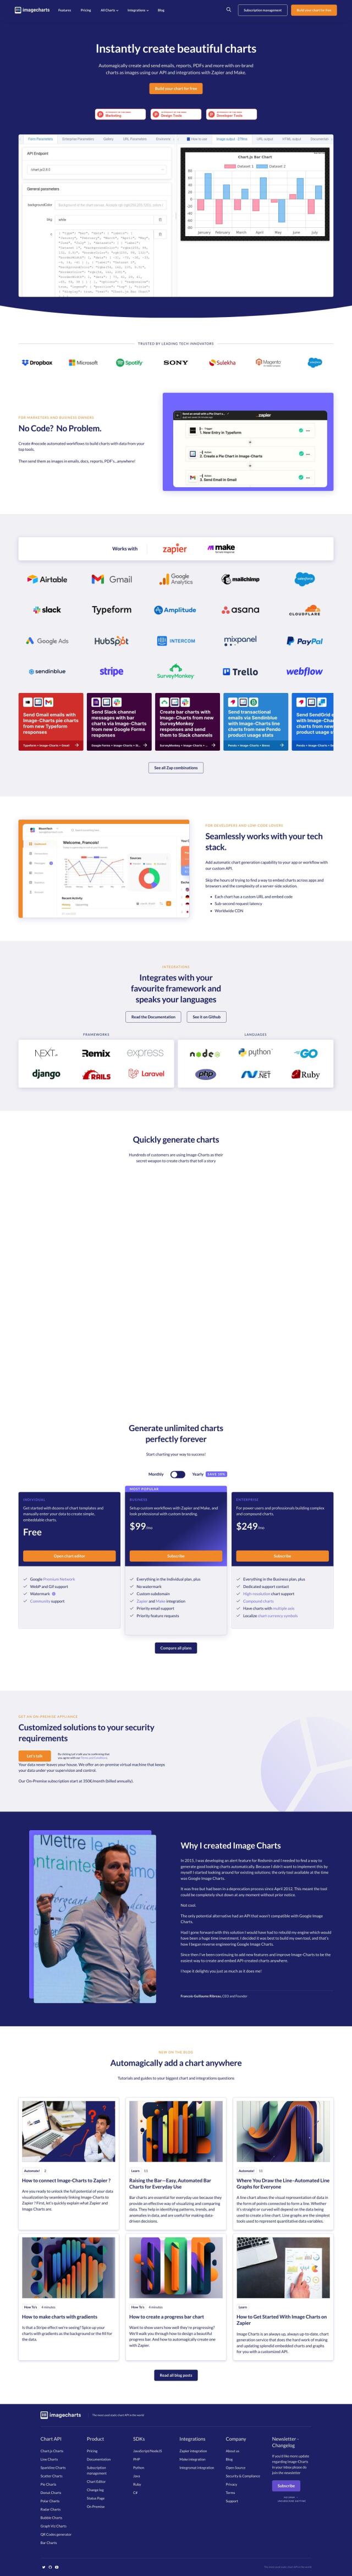
Image Charts screenshot thumbnail

Image Charts

If you want a service that works with Google Drive and Google Sheets to create visualizations, Image Charts is a great choice. It can automatically generate charts in many different styles and customize them in various ways. Image Charts connects to Google Drive, Google Forms, Google Sheets, Dropbox and Pipedrive, so you can use Zapier and Make to automate chart generation. It has several pricing tiers, including a free version with manual data input and watermarks.

Polymer screenshot thumbnail

Polymer

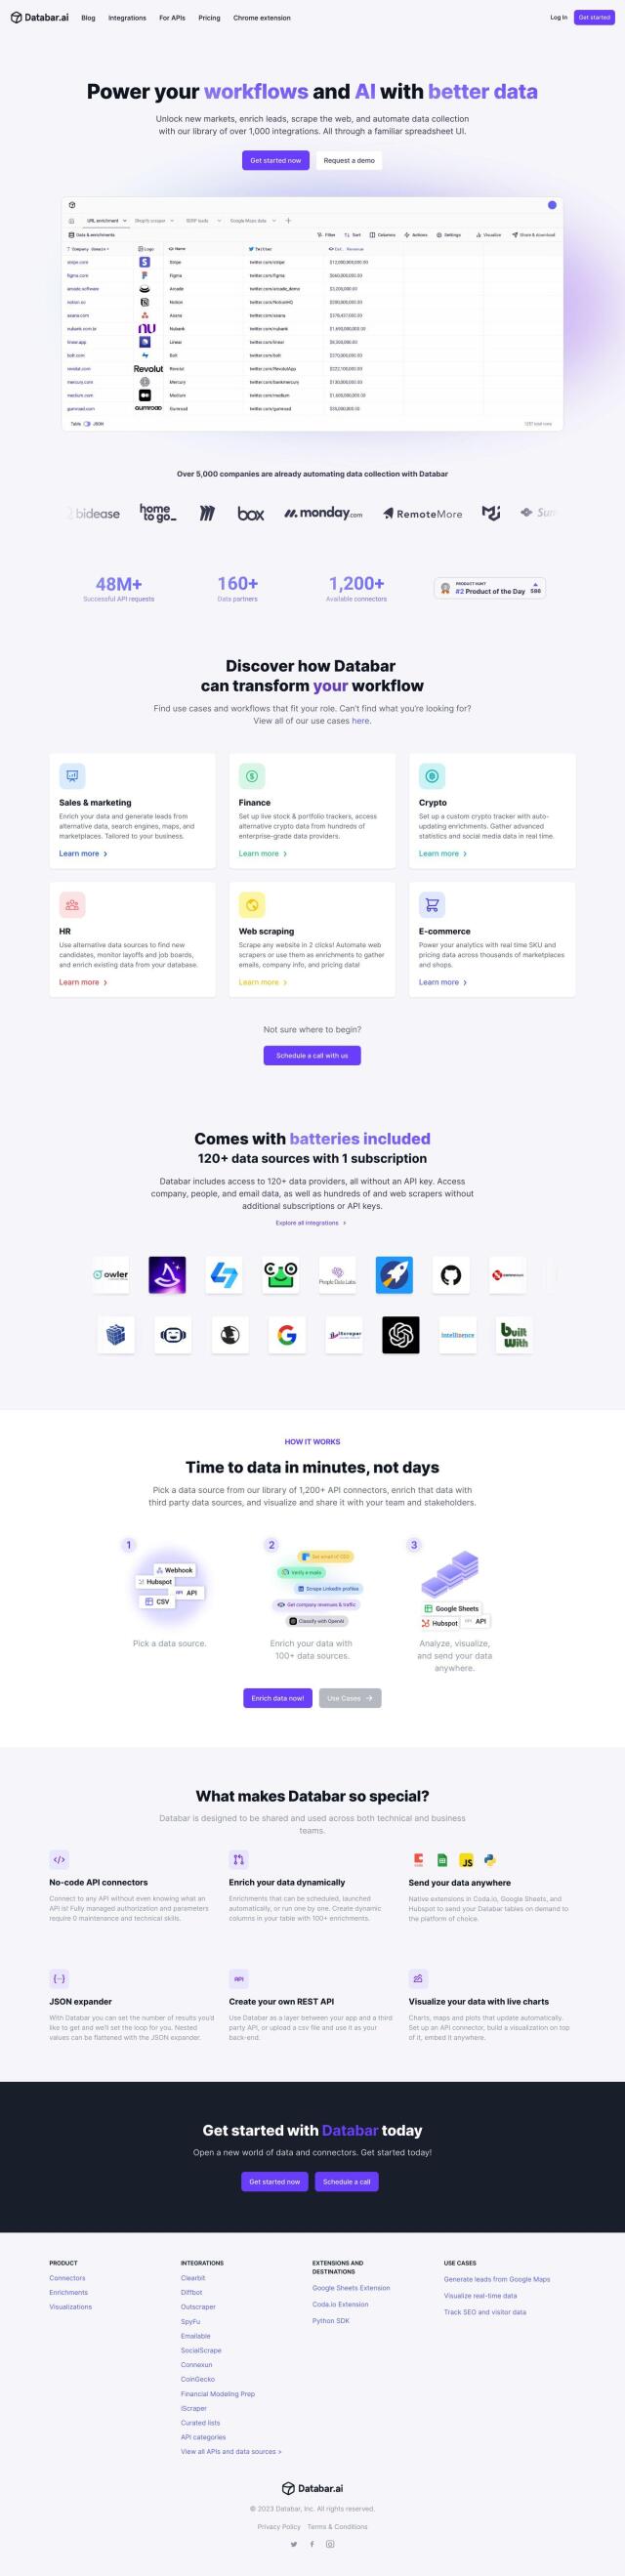
Another option is Polymer, which transforms complex data into insights and connects to many data sources, including Google Sheets. It can provide real-time insights by automatically updating dashboards and offer personalized views. Features include prebuilt templates, easy sharing and customization to match brand colors and styling, making it a good choice for data analysis and presentation.

Onvo screenshot thumbnail

Onvo

If you prefer an AI-powered service, Onvo offers interactive charts and insights without having to write complex queries or fiddle with data formatting. It connects to Google Sheets and other data sources, and offers several pricing plans depending on your needs. Onvo's AI technology makes data visualization easy, and it's good for startups and big businesses.

Additional AI Projects

GPT Workspace screenshot thumbnail

GPT Workspace

Automates work in Google Workspace tools by using AI to create content, categorize data, and offer writing suggestions, boosting productivity and efficiency.

Flowshot screenshot thumbnail

Flowshot

Boost spreadsheet productivity with AI-driven autocompletion, formula generation, and image creation, all accessible within a visual Google Sheets sidebar interface.

Graphy screenshot thumbnail

Graphy

Combine data from multiple sources into interactive, shareable reports in minutes, with AI-powered tools reducing creation time by 80%.

Neptyne screenshot thumbnail

Neptyne

Run Python code directly in Google Sheets, integrating with popular data science tools and enabling advanced data analysis, processing, and visualization capabilities.

Luminal screenshot thumbnail

Luminal

Automate complex spreadsheet tasks up to 10 times faster with AI-driven cleaning, transformation, and analysis, using natural language prompts.

Formula Bot screenshot thumbnail

Formula Bot

Turns text into various outputs, including Excel formulas, SQL queries, and more, to accelerate data analysis and spreadsheet workflows.

SheetAI screenshot thumbnail

SheetAI

Automate tedious tasks in Google Sheets by describing them in plain language, and see the results with AI-powered functions and insights.

Numerous.ai screenshot thumbnail

Numerous.ai

Embeds ChatGPT into Google Sheets and Excel, enabling easy access to AI abilities without API keys, for streamlined team collaboration and cost-effective results.

Tabula screenshot thumbnail

Tabula

Automate data workflows, standardize disparate sources, and gain real-time insights without coding, empowering data-driven decision-making across departments.

Jeda.ai screenshot thumbnail

Jeda.ai

Collaborative, interactive canvas for creating, visualizing, and analyzing data, turning ideas into beautiful visuals and insights with advanced generative AI capabilities.

Databar screenshot thumbnail

Databar

Connect to 1,000+ APIs without coding, automate workflows, and enrich data in real-time to power business operations across various industries.

Spreadsheet.com screenshot thumbnail

Spreadsheet.com

Combines spreadsheet interface with automation, customizable views, and integrations to streamline project management, data tracking, and team collaboration.

Canvas screenshot thumbnail

Canvas

Link, query, and visualize data from 150+ SaaS tools without coding, empowering non-technical teams to make data-informed decisions.

ILLA Cloud screenshot thumbnail

ILLA Cloud

Build custom data analysis dashboards and internal apps with ease, automating processes and integrating AI agents to drive business decisions and increase productivity.

TABLUM.IO screenshot thumbnail

TABLUM.IO

Automatically converts raw, unstructured data from various sources into analytics-ready SQL tables, streamlining data preparation and integration.

Quadratic screenshot thumbnail

Quadratic

Combines spreadsheet comfort with Python, SQL, and AI power, enabling data scientists and analysts to process and visualize data with unprecedented flexibility.

Peaka screenshot thumbnail

Peaka

Links multiple data sources, including databases and APIs, into a single queryable source, eliminating ETL processes and enabling real-time data access.

Airtable screenshot thumbnail

Airtable

Operationalize data and redesign workflows with AI-driven automation, custom interfaces, and real-time data visualization, all without extensive coding.

Slatebox screenshot thumbnail

Slatebox

Create editable visualizations from natural language prompts in real-time, fostering efficient team collaboration and diagram creation.

Vizzly screenshot thumbnail

Vizzly

Build and share interactive, customizable analytics experiences with a no-code dashboard builder, empowering users to explore data without technical hassle.

AITable screenshot thumbnail

AITable

Streamline workflow automation with a visual database, connecting to over 6,000 apps, and automate repetitive tasks with customizable forms and AI-driven content generation.