Question: I'm looking for a no-code solution to automate chart creation from data in multiple tools, can you suggest something?

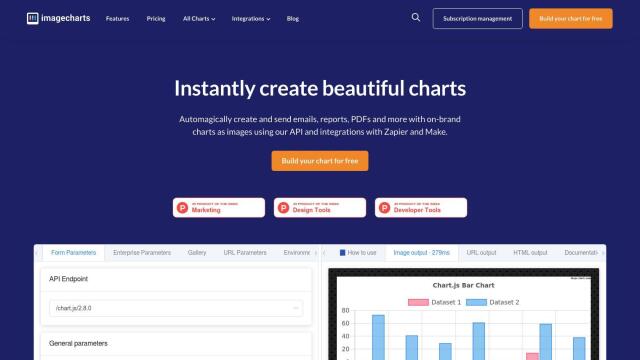
Image Charts screenshot thumbnail

Image Charts

If you want a no-code way to automate chart generation from data in other tools, Image Charts is a good option. It can link to tools like Zapier and Make to set up automated processes, and it can pull data from Google Drive, Google Forms, Google Sheets, Dropbox and Pipedrive. Image Charts offers a variety of chart types and some high-level customization options, including multiple axes and high-resolution output. Pricing starts with a free option for individuals and moves to business and enterprise options for more features.

Onvo screenshot thumbnail

Onvo

Another option is Onvo, an AI data visualization tool that lets people create interactive charts and dashboards without having to wrestle with raw data. It can connect to data sources like MongoDB, PostgreSQL, Google Sheets and Salesforce, and offers features like automated workflows, interactive visualizations and personalized analysis. That makes it suitable for startups and enterprises that want to simplify their data visualization workflow.

DataChat screenshot thumbnail

DataChat

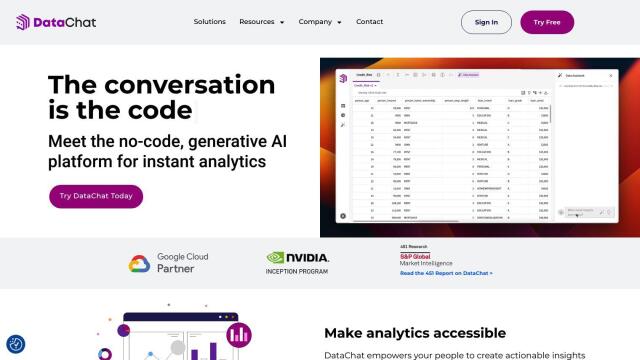
If you prefer a more generative AI approach, DataChat could be for you. The no-code tool lets you transform complex data into usable insights through an interface that's similar to a spreadsheet. With features like AI-generated answers, built-in machine learning and automated data prep, DataChat is geared for data scientists, analysts and business users who need fast and trustworthy insights.

Graphy screenshot thumbnail

Graphy

Last, Graphy offers a powerful no-code interface for generating interactive reports based on data from sources like Hubspot and Google Analytics. It offers one-click data import and AI-powered productivity, which makes it a good choice for data-driven marketers and teams that want to better inform stakeholders. With a free tier and flexible pricing options, Graphy is a relatively inexpensive way to automate report generation and visualization.

Additional AI Projects

Tabula screenshot thumbnail

Tabula

Automate data workflows, standardize disparate sources, and gain real-time insights without coding, empowering data-driven decision-making across departments.

Formula Bot screenshot thumbnail

Formula Bot

Turns text into various outputs, including Excel formulas, SQL queries, and more, to accelerate data analysis and spreadsheet workflows.

Spreadsheet.com screenshot thumbnail

Spreadsheet.com

Combines spreadsheet interface with automation, customizable views, and integrations to streamline project management, data tracking, and team collaboration.
Chartonomics screenshot thumbnail

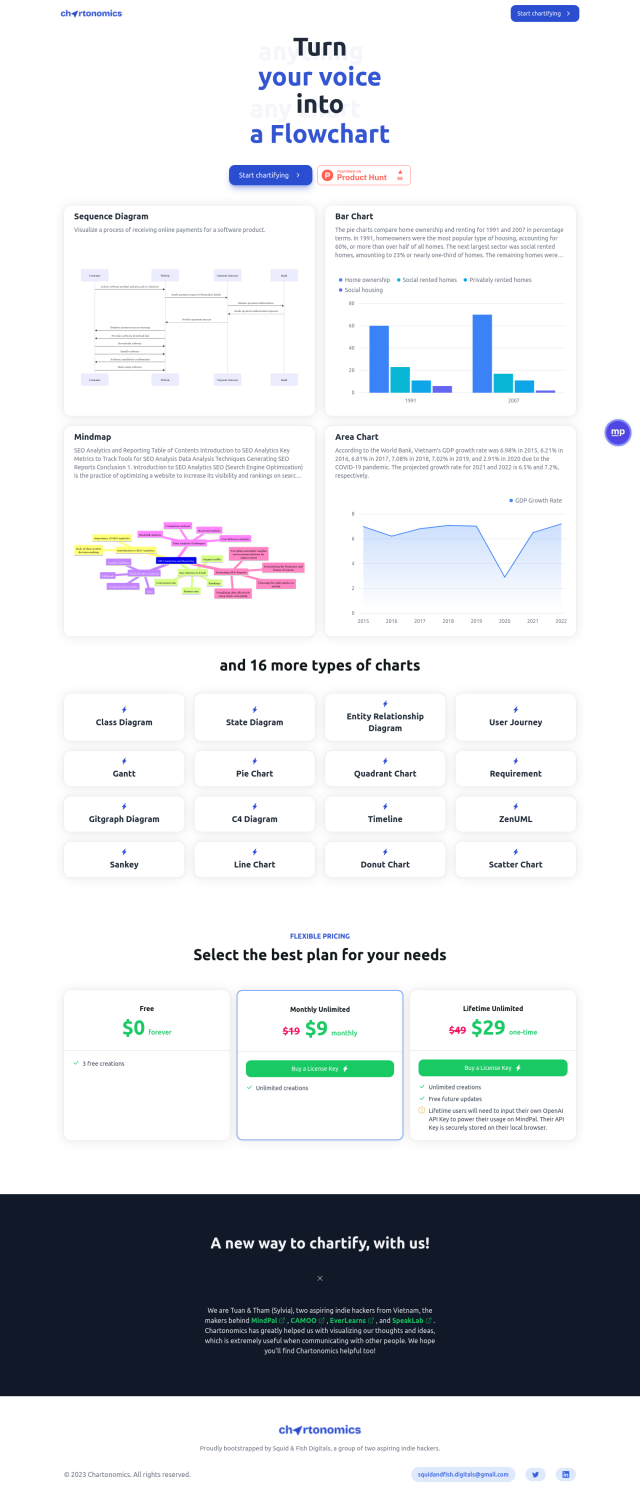
Chartonomics

Convert any data into 20+ chart types with a single click, no setup required, for instant visualization and communication of complex ideas.
Airbook screenshot thumbnail

Airbook

Accelerate data analysis and insights generation across teams with native connectors to 150+ data sources, collaborative querying, and visualization tools.

Piktochart screenshot thumbnail

Piktochart

Create professional-looking designs without design skills, leveraging a drag-and-drop editor, data visualization, and customization options to produce engaging visual content.

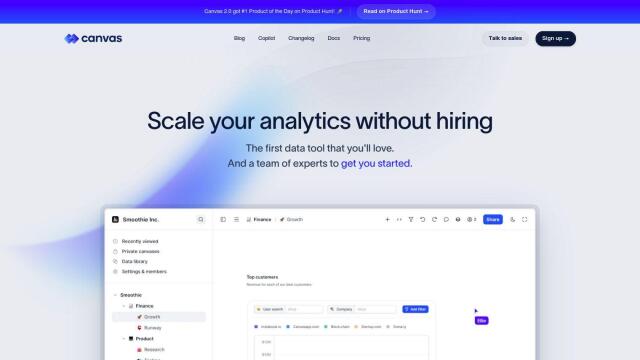
Canvas screenshot thumbnail

Canvas

Link, query, and visualize data from 150+ SaaS tools without coding, empowering non-technical teams to make data-informed decisions.

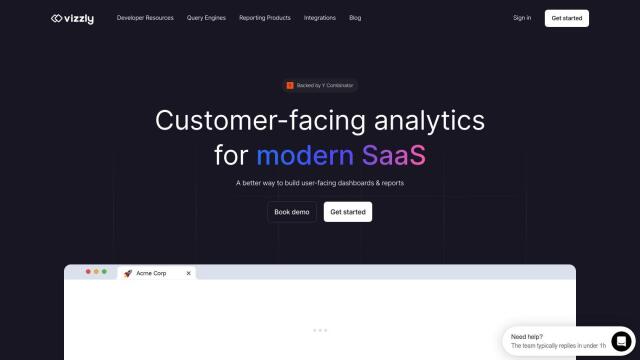
Vizzly screenshot thumbnail

Vizzly

Build and share interactive, customizable analytics experiences with a no-code dashboard builder, empowering users to explore data without technical hassle.

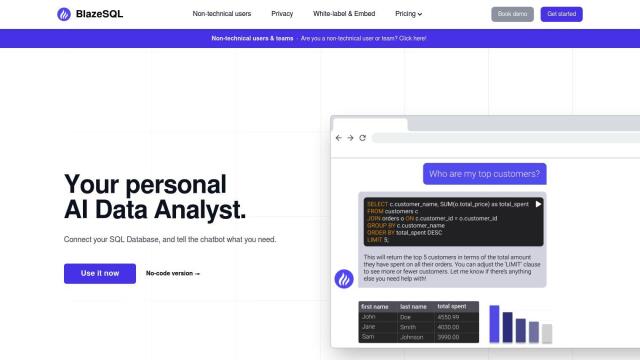
Blaze SQL screenshot thumbnail

Blaze SQL

Ask a question, get instant data insights with automated SQL queries, charts, and dashboards, no coding required.

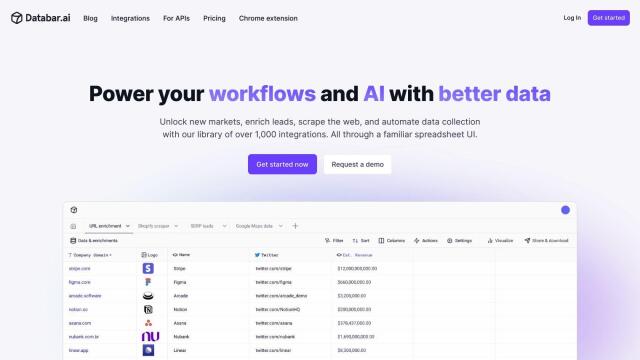
Databar screenshot thumbnail

Databar

Connect to 1,000+ APIs without coding, automate workflows, and enrich data in real-time to power business operations across various industries.

Formaloo screenshot thumbnail

Formaloo

Create engaging, customizable surveys with infinitely adaptable blocks, insightful dashboards, and seamless workflow connections to gather actionable customer insights.

MarkovML screenshot thumbnail

MarkovML

Transform work with AI-powered workflows and apps, built and deployed without coding, to unlock instant data insights and automate tasks.

Airtable screenshot thumbnail

Airtable

Operationalize data and redesign workflows with AI-driven automation, custom interfaces, and real-time data visualization, all without extensive coding.

Embeddable screenshot thumbnail

Embeddable

Craft compelling customer-facing analytics experiences and embed them directly into your application, with full control and flexibility, in a fraction of the time.

Lido screenshot thumbnail

Lido

Automate tasks and workflows in Google Sheets without programming skills, extracting data and pushing it to email, Slack, calendars, and other destinations.

Glide screenshot thumbnail

Glide

Build custom apps powered by AI without coding, integrating with existing data and deploying to any device with self-designing layouts.

Obviously AI screenshot thumbnail

Obviously AI

Automate data science tasks to build and deploy industry-leading predictive models in minutes, without coding, for classification, regression, and time series forecasting.

VectorShift screenshot thumbnail

VectorShift

Build and deploy AI-powered applications with a unified suite of no-code and code tools, featuring drag-and-drop components and pre-built pipelines.

Zapier screenshot thumbnail

Zapier

Automate tasks and workflows across 7,000+ apps with AI-powered technology, customizing your workflow to focus on high-priority business tasks.

ChatUML screenshot thumbnail

ChatUML

Rapidly generates clear, accurate, and well-formatted diagrams using AI algorithms, freeing you to focus on substance and structure.