Question: Is there a way to create custom-branded charts with unique URLs for sharing with clients or stakeholders?
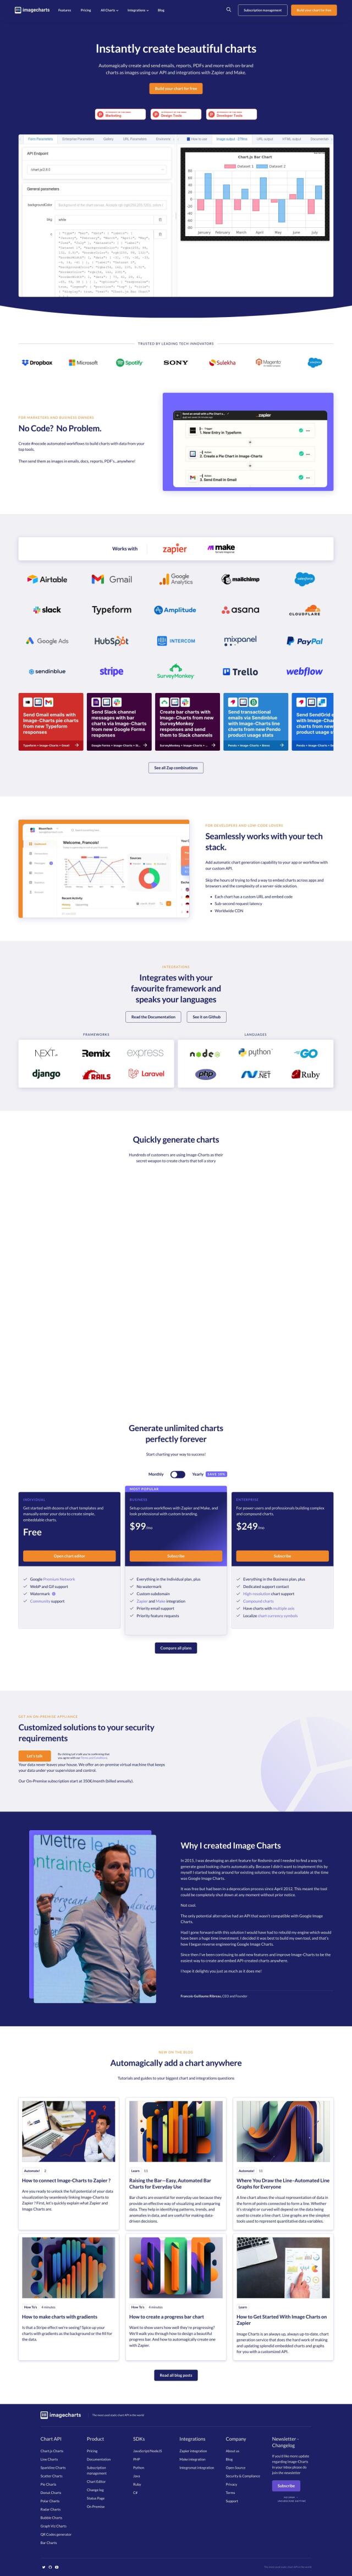
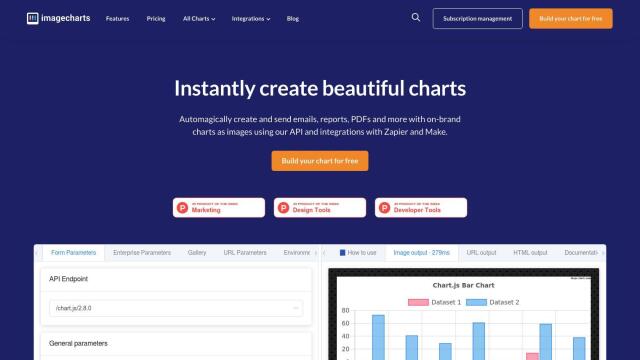
Image Charts screenshot thumbnail

Image Charts

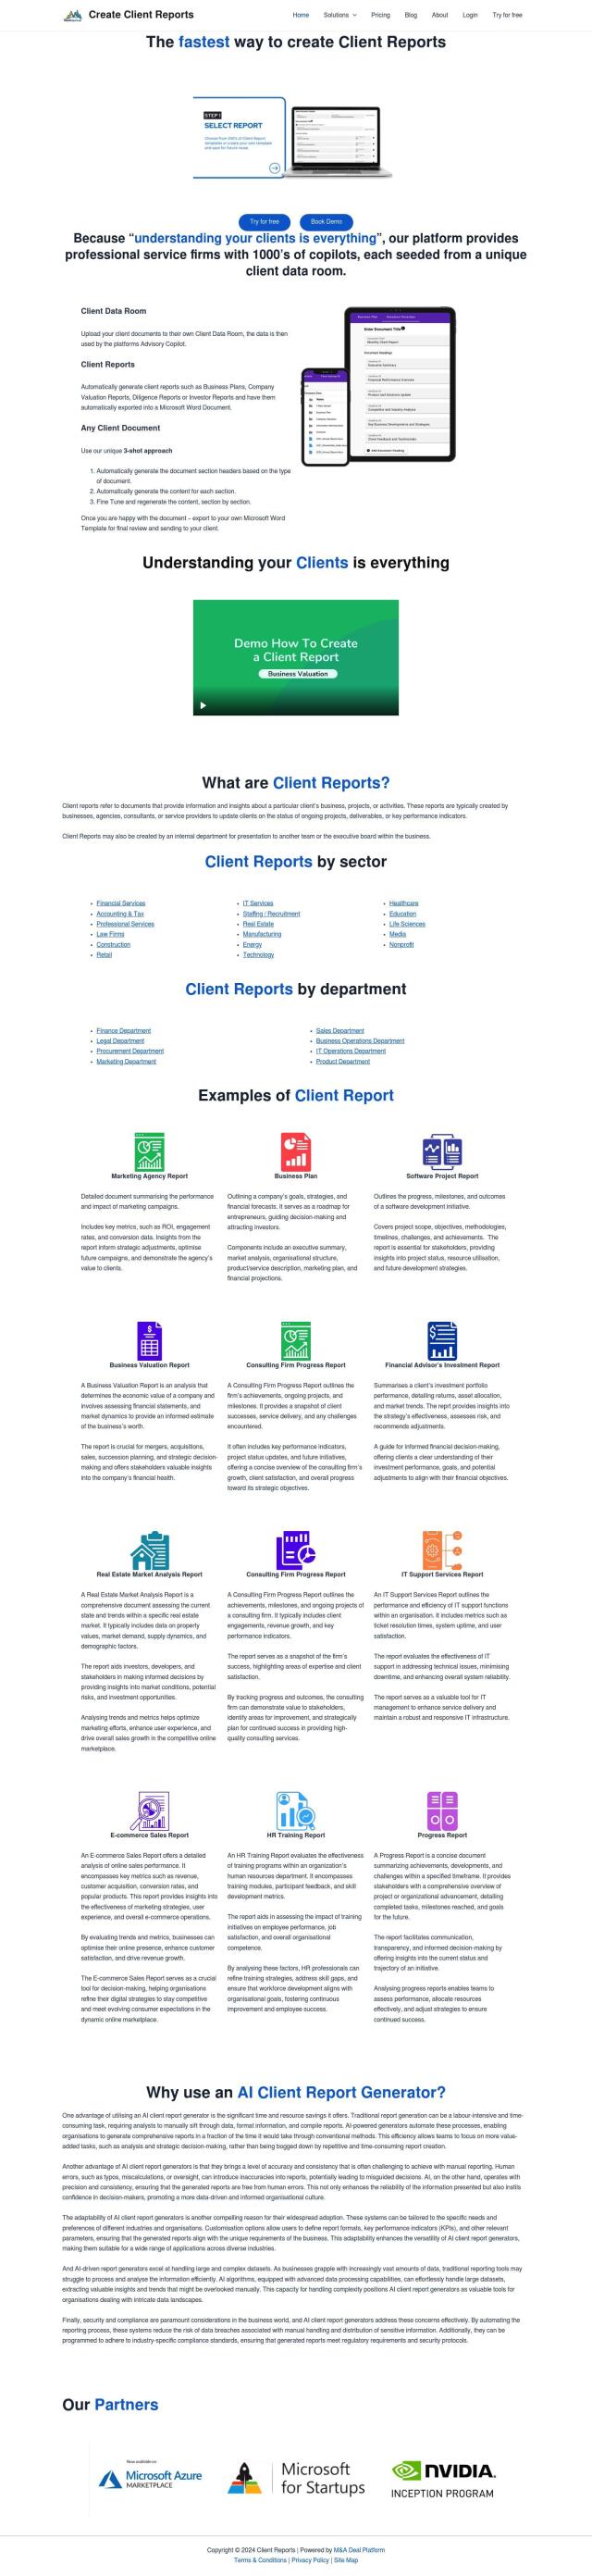
If you want to generate charts with your own branding and shareable URLs for your customers or other stakeholders, Image Charts is worth a look. It offers a range of chart types, including line, pie and scatter charts, and offers a lot of customization options, including dual axes and backgrounds. Image Charts offers shareable URLs and can be integrated with Google Drive, Google Forms and Dropbox through Zapier and Make. Pricing starts with a free individual account and goes up to a $99/month business account and $249/month enterprise account.

Graphy screenshot thumbnail

Graphy

Another option is Graphy, which is geared for interactive reports based on multiple data sources. It can import data with a single click from Google Sheets and Meta Ads, and offers customizable charts with annotations and emojis. Graphy's pricing plan is flexible, with a free plan that offers unlimited interactive charts and unlimited users, and a Plus plan starting at $16 per user per month that offers custom brand colors and removal of Graphy's watermark.

Onvo screenshot thumbnail

Onvo

If you prefer an AI-based approach, Onvo offers a service to create interactive charts and dashboards without having to write complex queries. Onvo lets you customize branding and share or embed dashboards in your own products. It offers a range of pricing plans, including Personal, Growth and Enterprise. Its integration with data sources like Google Sheets and applications like Salesforce and HubSpot means it can be used to automate data visualization workflows.

Polymer screenshot thumbnail

Polymer

Also worth a look is Polymer, an AI-powered dashboard creation service that can link multiple data sources and create dashboards rapidly without requiring any programming. It's got more than 20 data connectors and can offer real-time insights through automated dashboard updates. Polymer also offers options to match brand colors and styles, so you can easily share and present data insights.

Additional AI Projects

Tome screenshot thumbnail

Tome

Automates sales research and deck customization, analyzing internal and external data to create personalized presentations faster, boosting business intelligence and sales productivity.

Embeddable screenshot thumbnail

Embeddable

Craft compelling customer-facing analytics experiences and embed them directly into your application, with full control and flexibility, in a fraction of the time.

Vizzly screenshot thumbnail

Vizzly

Build and share interactive, customizable analytics experiences with a no-code dashboard builder, empowering users to explore data without technical hassle.

Piktochart screenshot thumbnail

Piktochart

Create professional-looking designs without design skills, leveraging a drag-and-drop editor, data visualization, and customization options to produce engaging visual content.

Chartonomics screenshot thumbnail

Chartonomics

Convert any data into 20+ chart types with a single click, no setup required, for instant visualization and communication of complex ideas.

Spreadsheet.com screenshot thumbnail

Spreadsheet.com

Combines spreadsheet interface with automation, customizable views, and integrations to streamline project management, data tracking, and team collaboration.

Explo screenshot thumbnail

Explo

Embed interactive dashboards and self-serve reporting directly into products, enabling end-users to customize analytics experiences and make better decisions.

Hurree screenshot thumbnail

Hurree

Get instant insights without being a data expert, with one-click connections, centralized visualization, and AI-powered analysis transforming hours into clicks.

Visme screenshot thumbnail

Visme

Create on-brand content fast with AI-assisted design, templates, and collaboration tools, even without design experience.

Jeda.ai screenshot thumbnail

Jeda.ai

Collaborative, interactive canvas for creating, visualizing, and analyzing data, turning ideas into beautiful visuals and insights with advanced generative AI capabilities.

Canvas screenshot thumbnail

Canvas

Link, query, and visualize data from 150+ SaaS tools without coding, empowering non-technical teams to make data-informed decisions.

Tabula screenshot thumbnail

Tabula

Automate data workflows, standardize disparate sources, and gain real-time insights without coding, empowering data-driven decision-making across departments.

eqtble screenshot thumbnail

eqtble

Centralizes people data from various sources, enabling analysts to create data-driven stories and collaborate with others to drive informed decision-making.

Softr screenshot thumbnail

Softr

Build custom client portals, internal tools, and community hubs without coding, using pre-built blocks and connecting to various data sources.

EdrawMax screenshot thumbnail

EdrawMax

Create engaging diagrams in seconds with AI-powered tools, leveraging a vast template library and collaborative workspace for seamless visual collaboration.

Slatebox screenshot thumbnail

Slatebox

Create editable visualizations from natural language prompts in real-time, fostering efficient team collaboration and diagram creation.

Grafbase screenshot thumbnail

Grafbase

Unify data sources into a single graph, deploy anywhere, and enjoy advanced security, caching, and analytics for seamless GraphQL API development.

Opinion Stage screenshot thumbnail

Opinion Stage

Create interactive visual quizzes, polls, and surveys with AI-assisted creation, personalization, and skip logic for more targeted results and increased engagement.

DocsBot screenshot thumbnail

DocsBot

Train custom chatbots on your documentation and content to provide immediate answers, saving time and improving support for customers and teams.

ClientReports screenshot thumbnail

ClientReports

Automatically generate professional client reports with ease, streamlining the process with a 3-shot approach to headers, content, and fine-tuning.