Question: Can you recommend a tool that automatically generates charts from data for reports and emails?
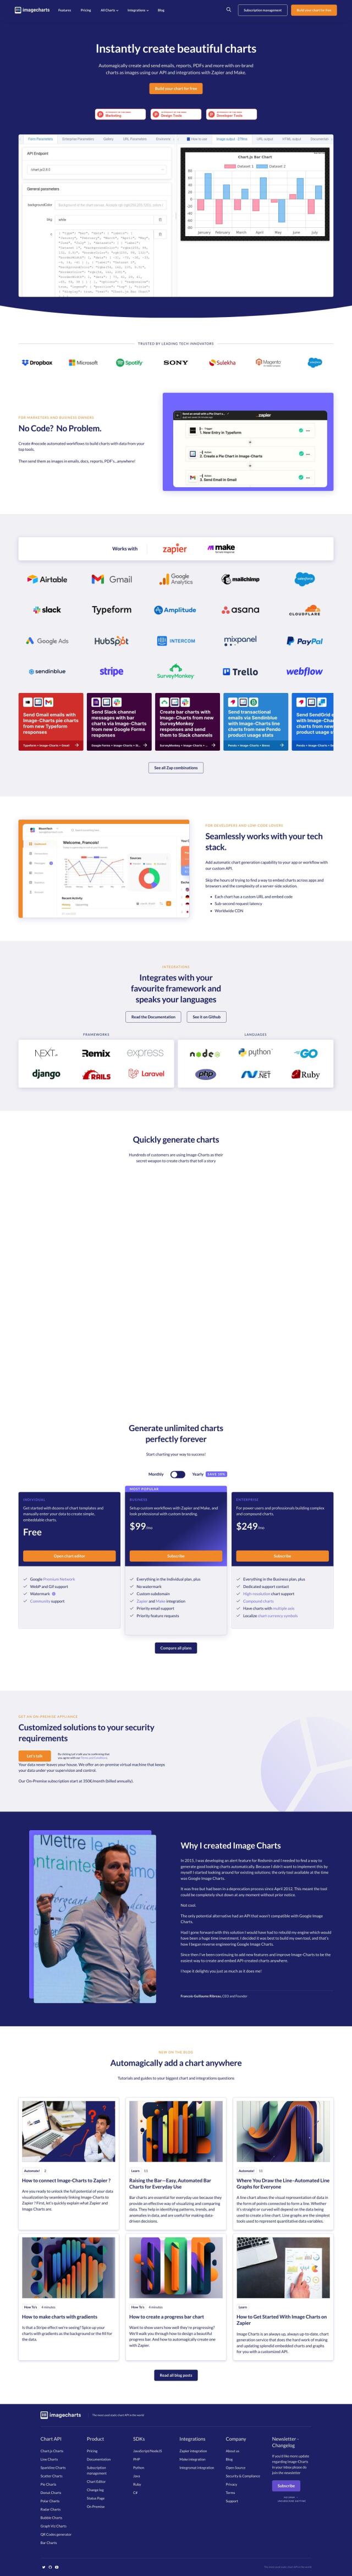
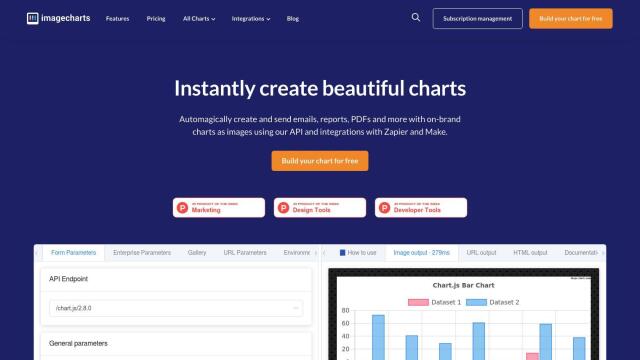
Image Charts screenshot thumbnail

Image Charts

If you need a service to generate charts automatically from data for reports and email, Image Charts is a great option. It can be integrated with services like Zapier and Make so you can set up no-code workflows that draw data from services like Google Sheets and Dropbox. Image Charts offers a range of chart types, including line, pie and scatter charts, and high-resolution output and customization options. Prices range from free for basic use to $249 per month for enterprise features.

Onvo screenshot thumbnail

Onvo

Another good option is Onvo, an AI-powered data visualization service that doesn't need you to write complicated queries or fiddle with data formatting. It connects to many data sources and lets you create dashboards with simple AI prompts. Onvo's interactive visualizations and customizable branding make it a good option for startups and enterprises that want to automate workflows and create engaging dashboards.

Graphy screenshot thumbnail

Graphy

If you need interactive reports fast, Graphy is a good option. It can consolidate data from sources like Google Analytics and LinkedIn Ads into a single view and create interactive reports in less than two minutes. Graphy's AI-powered productivity reduces report creation time dramatically and offers customizable visualizations and a flexible pricing model.

DataChat screenshot thumbnail

DataChat

Last, DataChat is a no-code service that can turn complex data into actionable information without programming. It uses an interface that's something like a spreadsheet and chat software, so data analysis is accessible to anyone. DataChat automates data prep and modeling, so it's good for data scientists and business users.

Additional AI Projects

Chartonomics screenshot thumbnail

Chartonomics

Convert any data into 20+ chart types with a single click, no setup required, for instant visualization and communication of complex ideas.

Spreadsheet.com screenshot thumbnail

Spreadsheet.com

Combines spreadsheet interface with automation, customizable views, and integrations to streamline project management, data tracking, and team collaboration.

Blaze SQL screenshot thumbnail

Blaze SQL

Ask a question, get instant data insights with automated SQL queries, charts, and dashboards, no coding required.

ChatCSV screenshot thumbnail

ChatCSV

Ask plain language questions about your CSV data and receive chart answers, with automated starting points and conversation history for easy analysis.

Jeda.ai screenshot thumbnail

Jeda.ai

Collaborative, interactive canvas for creating, visualizing, and analyzing data, turning ideas into beautiful visuals and insights with advanced generative AI capabilities.

Formula Bot screenshot thumbnail

Formula Bot

Turns text into various outputs, including Excel formulas, SQL queries, and more, to accelerate data analysis and spreadsheet workflows.

Piktochart screenshot thumbnail

Piktochart

Create professional-looking designs without design skills, leveraging a drag-and-drop editor, data visualization, and customization options to produce engaging visual content.

Polymer screenshot thumbnail

Polymer

Converts complex data into intuitive, actionable visualizations, linking multiple sources and generating real-time insights with AI-driven analytics and suggested trends.

Airbook screenshot thumbnail

Airbook

Accelerate data analysis and insights generation across teams with native connectors to 150+ data sources, collaborative querying, and visualization tools.

Canvas screenshot thumbnail

Canvas

Link, query, and visualize data from 150+ SaaS tools without coding, empowering non-technical teams to make data-informed decisions.

Hex screenshot thumbnail

Hex

Unify data teams with AI-assisted exploration, collaboration, and interactive reporting, accelerating data work and improving accuracy in a single, modular workspace.

Tabula screenshot thumbnail

Tabula

Automate data workflows, standardize disparate sources, and gain real-time insights without coding, empowering data-driven decision-making across departments.

ChatDB screenshot thumbnail

ChatDB

Query your database using natural language, with AI generating the necessary SQL, and create engaging charts for quick business insights.

Hurree screenshot thumbnail

Hurree

Get instant insights without being a data expert, with one-click connections, centralized visualization, and AI-powered analysis transforming hours into clicks.

Explo screenshot thumbnail

Explo

Embed interactive dashboards and self-serve reporting directly into products, enabling end-users to customize analytics experiences and make better decisions.

Rasgo screenshot thumbnail

Rasgo

Ask plain language questions and get instant, automated insights with 24/7 intelligent analysis, secured and customized with business context and visualizations.

Vizzly screenshot thumbnail

Vizzly

Build and share interactive, customizable analytics experiences with a no-code dashboard builder, empowering users to explore data without technical hassle.

eqtble screenshot thumbnail

eqtble

Centralizes people data from various sources, enabling analysts to create data-driven stories and collaborate with others to drive informed decision-making.

ANDRE screenshot thumbnail

ANDRE

Automates survey data analysis, transforming raw data into clear insights and stories with professional slide decks and strategic guidance.

FlowCharts.ai screenshot thumbnail

FlowCharts.ai

Build and send smart forms, surveys, and decision trees via SMS, email, and chatbots, with automated workflows and real-time data analysis.