Onvo
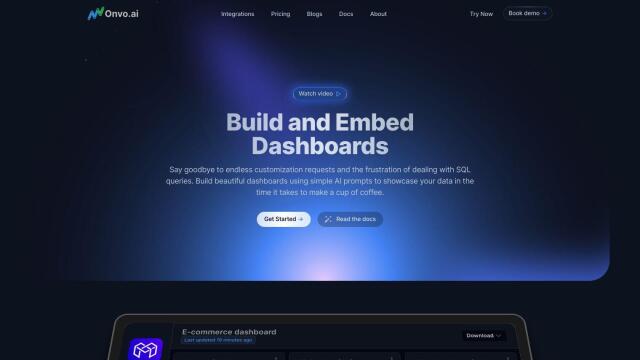
If you're looking for something to replace Image Charts, Onvo is another good option. Onvo is an AI-powered data visualization platform that makes it easy to create interactive charts and insights without having to write complex queries or manually manipulate data. It integrates with many data sources and lets you build dashboards with simple AI prompts, customize styling, and share or embed dashboards into your own products. It's good for startups and enterprises, with a variety of pricing tiers that integrate with sources like Google Sheets, Salesforce and HubSpot.

Graphy
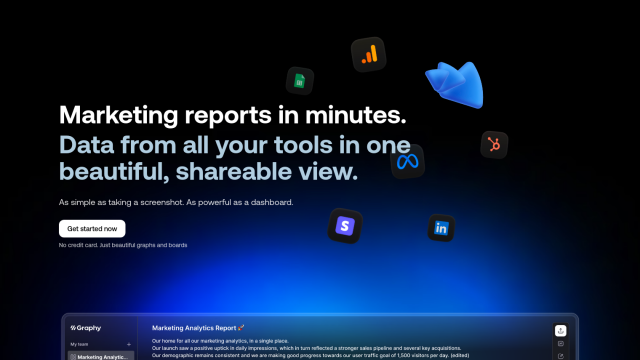
Another option is Graphy, which is geared for marketers and data teams that need to create interactive reports from different sources fast. Highlights include one-click data import from sources like Google Sheets and Meta Ads, interactive reports generated in under two minutes, and customizable charts with annotations and trend lines. Graphy has a flexible pricing structure with a free tier and a Plus tier at $16 per user/month, so it's good for data teams that want to automate reporting and help stakeholders understand what's going on.


Spreadsheet.com
Spreadsheet.com is another option. It improves project management, customer relationship management and other business tasks by combining the spreadsheet interface you're used to with new features and automation. It offers 14 types of charts, integrates with more than 4,000 apps, and has more than 200 templates for different use cases. It's particularly good for project managers, team managers and sales teams that need to coordinate and automate their work in a collaborative environment.

