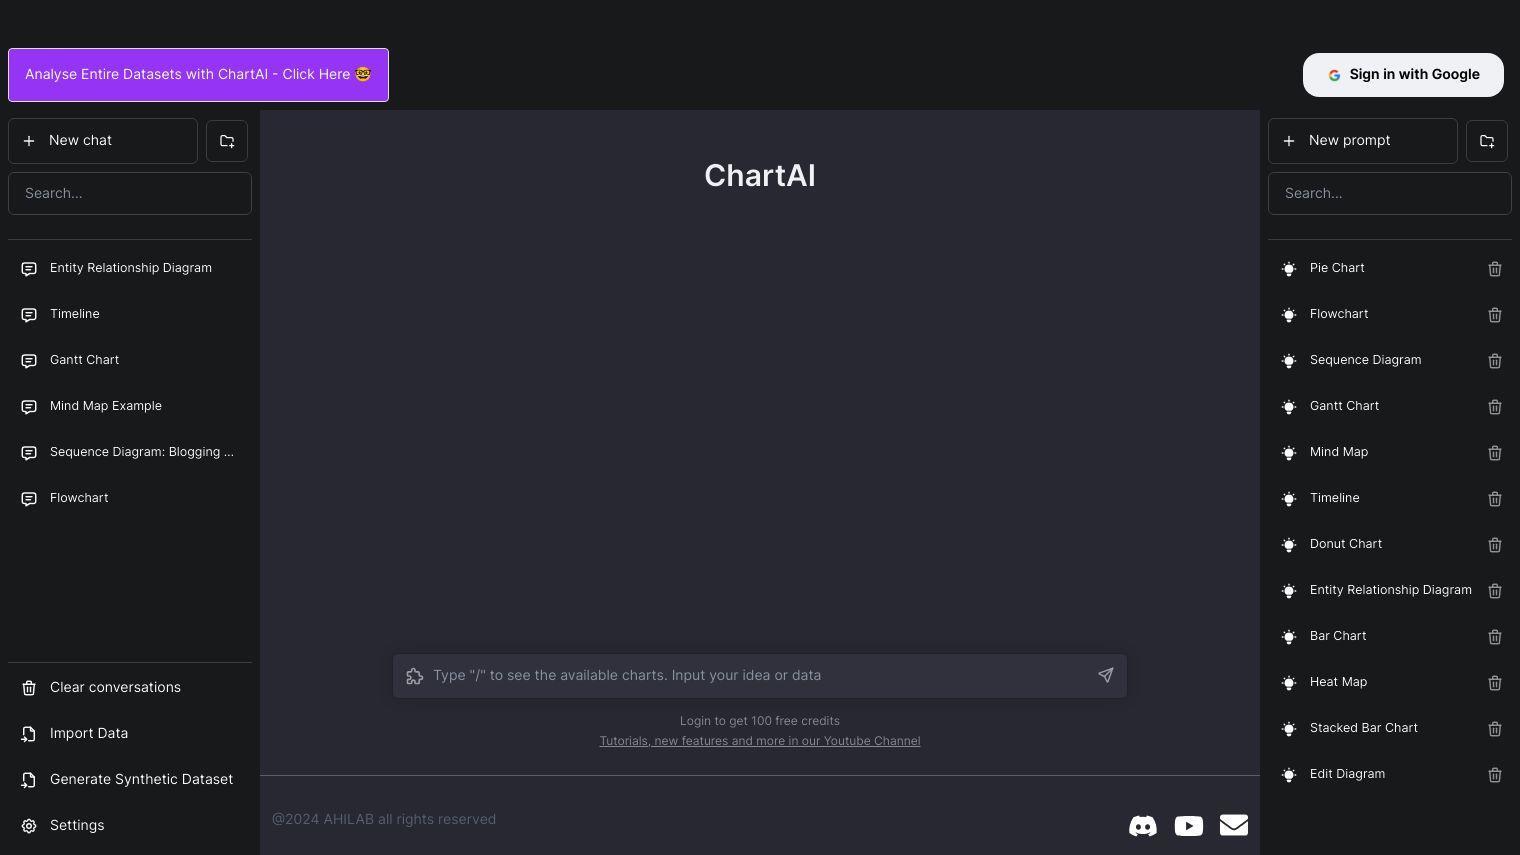
ChartAI is intended to process entire data sets with charts and graphs. In other words, it's a data visualization version of ChatGPT. ChartAI has a range of features to let people create different types of charts, diagrams and other visualizations.
Among the features are the ability to sign in with Google, start new conversations or chats, and import data to create synthetic data sets. You can create different types of charts and diagrams, including pie charts, flowcharts, sequence diagrams, Gantt charts, mind maps, timelines and more.
ChartAI also can handle entity relationship diagrams, bar charts, heat maps and stacked bar charts. You can keep the conversation going with all that. You can also find tutorials and explanations of new features on their YouTube channel.
The tool appears to be aimed at people who want to visualize and analyze data but don't have a lot of technical expertise. It could be useful for data analysts, project managers or anyone else who needs to visualize data.
Published on June 14, 2024
Related Questions
Tool Suggestions
Analyzing ChartAI...