Question: Is there a tool that can help me measure feature outcomes and create reports quickly and efficiently?

Querio
For measuring feature outcomes and generating reports, there are several tools worth considering. Querio is a data co-pilot geared for software companies. It automates data analysis and reporting so you can generate reports and analyze features 20 times faster. Querio provides real-time data analytics, a custom data catalog and integration for accurate results, and dramatically reduces data work.

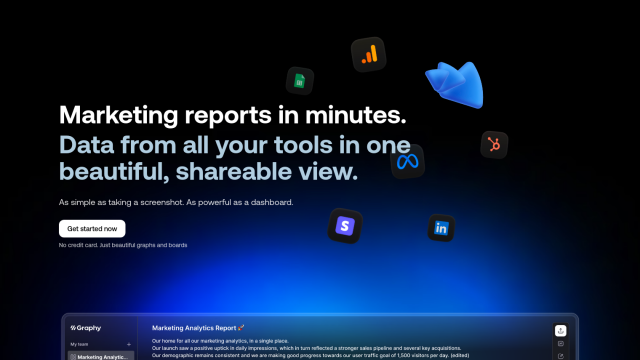
Graphy
Another good option is Graphy, geared for marketers and data-forward teams. It aggregates data from multiple sources into one cohesive view that can be shared, and you can build interactive reports in a matter of minutes. Features include one-click data import, AI-assisted productivity and customizable visualizations, so it's good for stakeholder reports and weekly/monthly summaries.

Squad
If you want to link feature outcomes to business outcomes, Squad has a product strategy tool that marries customer feedback and analytics. It builds roadmaps based on outcomes and generates actionable insights so teams can stay on the same page. Squad uses AI to match customer feedback to business outcomes for a more holistic product development approach.

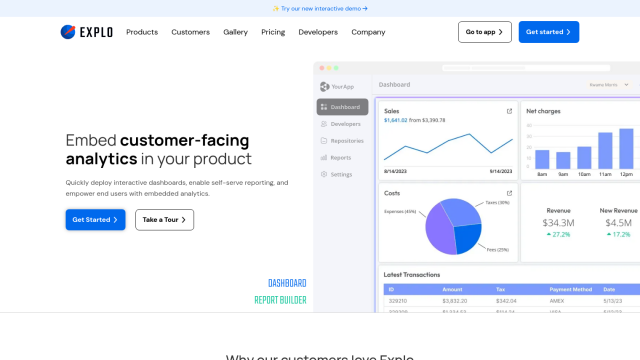
Explo
Last, Explo is an embedded analytics tool that lets product and engineering teams embed interactive dashboards and self-serve reporting into their apps. It can connect to multiple databases and data warehouses, with customizable dashboards and ad-hoc reporting, so it's good for a wide variety of business needs.

