Question: I need a dashboard that tracks GitHub activity, AppStore statistics, and user traffic for startups.
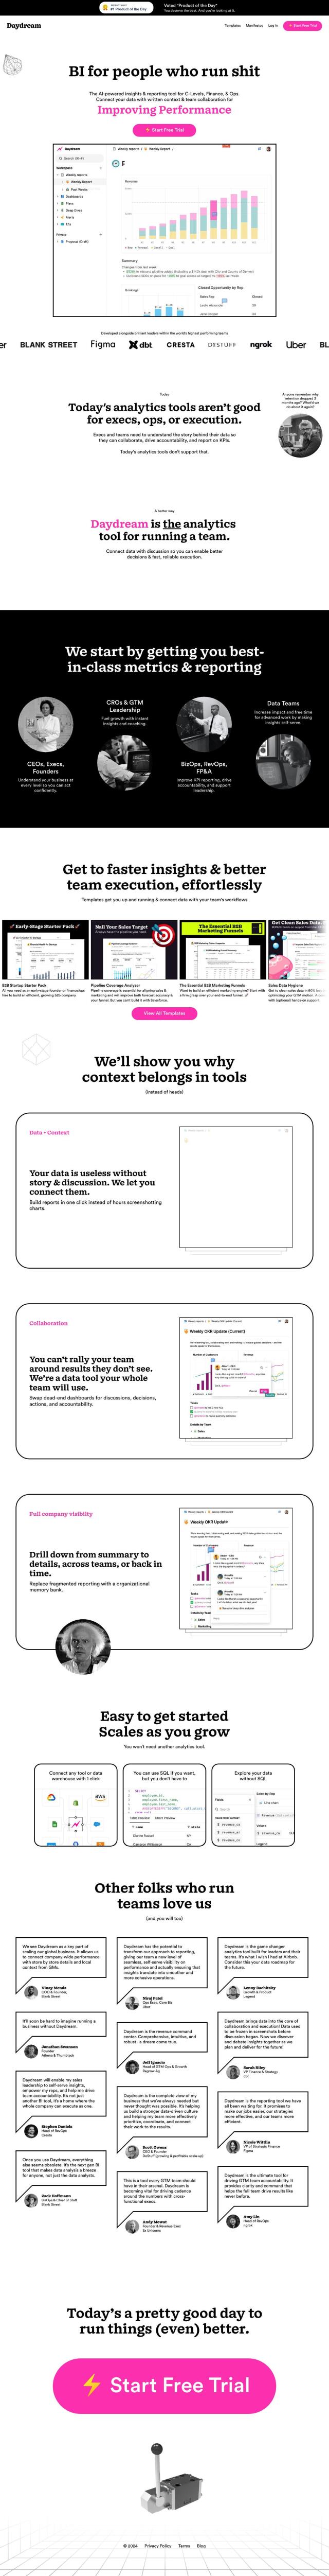
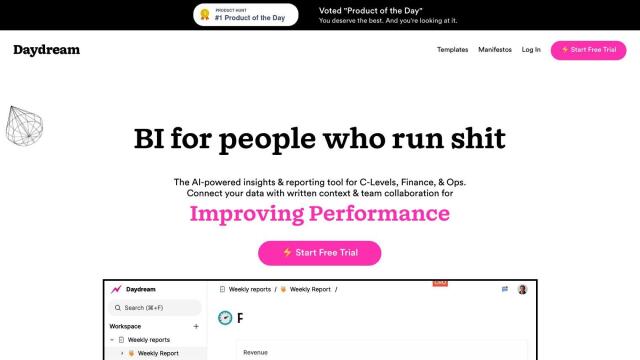
LemonRocks screenshot thumbnail

LemonRocks

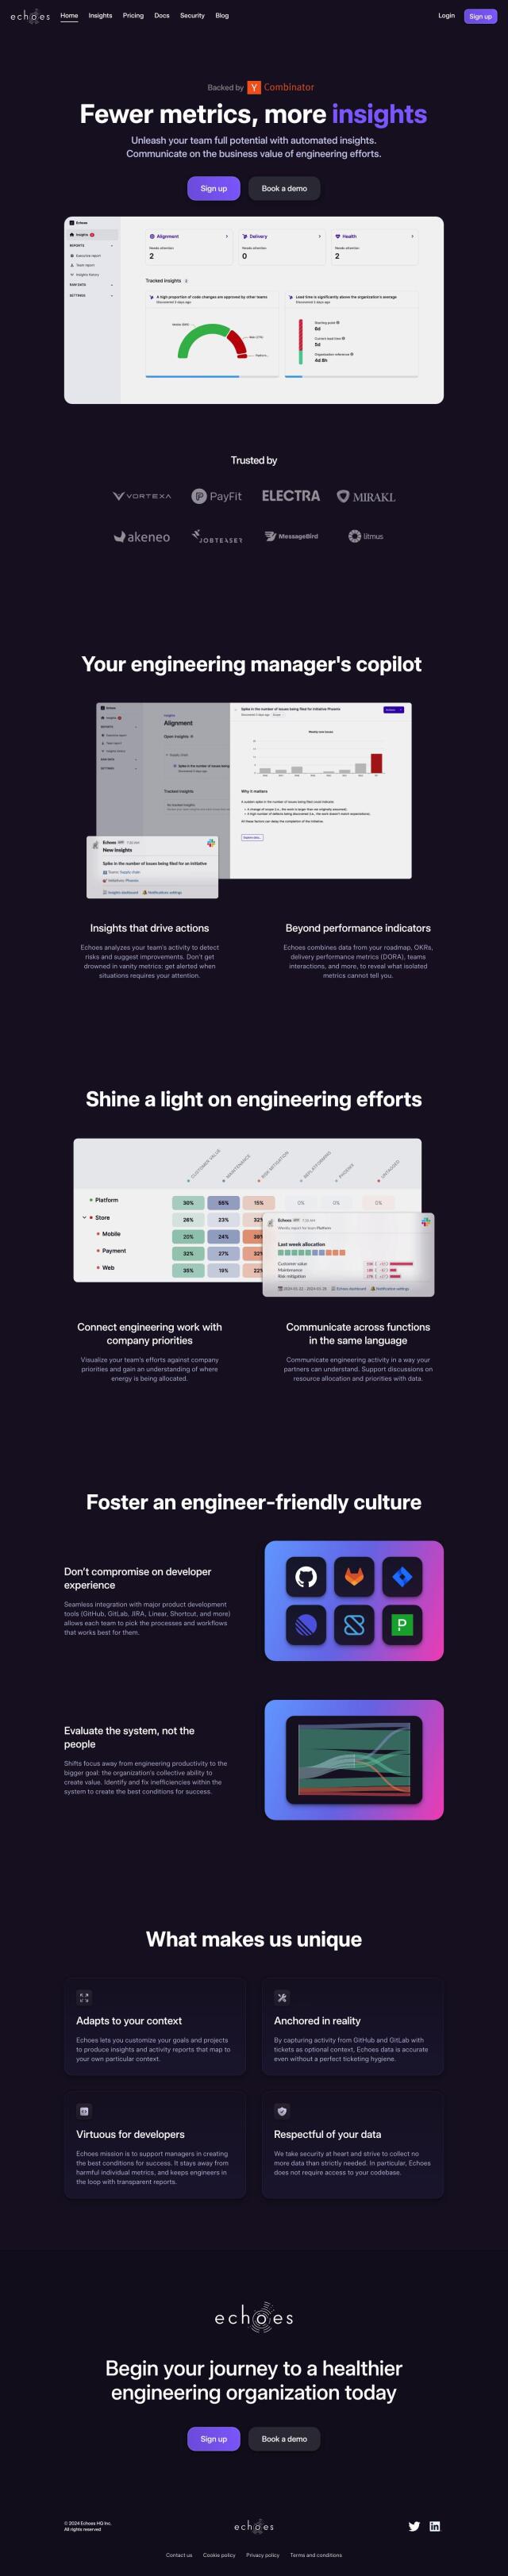
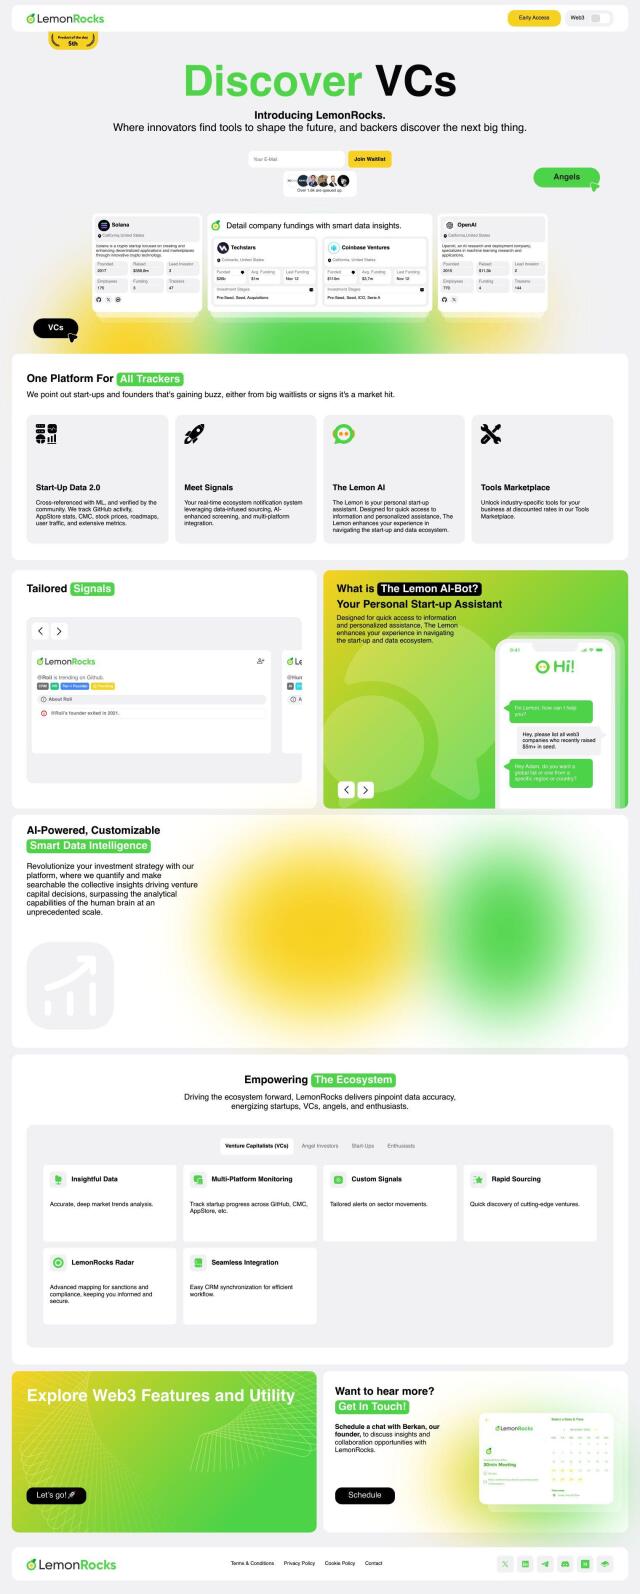
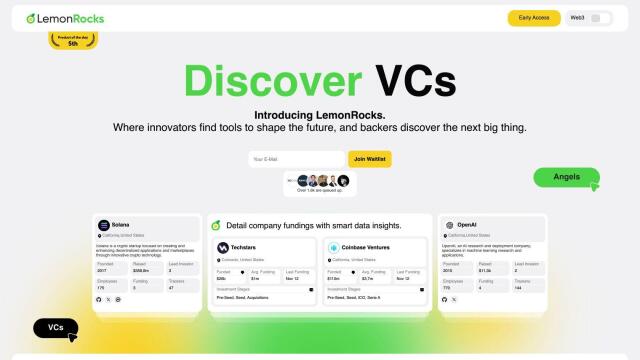
If you want a single dashboard to monitor GitHub activity, AppStore statistics and user traffic for your startup, LemonRocks could be the ticket. It's a powerful interface that tracks GitHub activity, AppStore statistics, CoinMarketCap data and user traffic, and it's got a real-time alert system called Signals and a personal assistant called Lemon AI that can help you get quick answers and get help. It's customizable, too, with modules for tracking investments, community insights and a more advanced mapping system for sanctions and compliance.
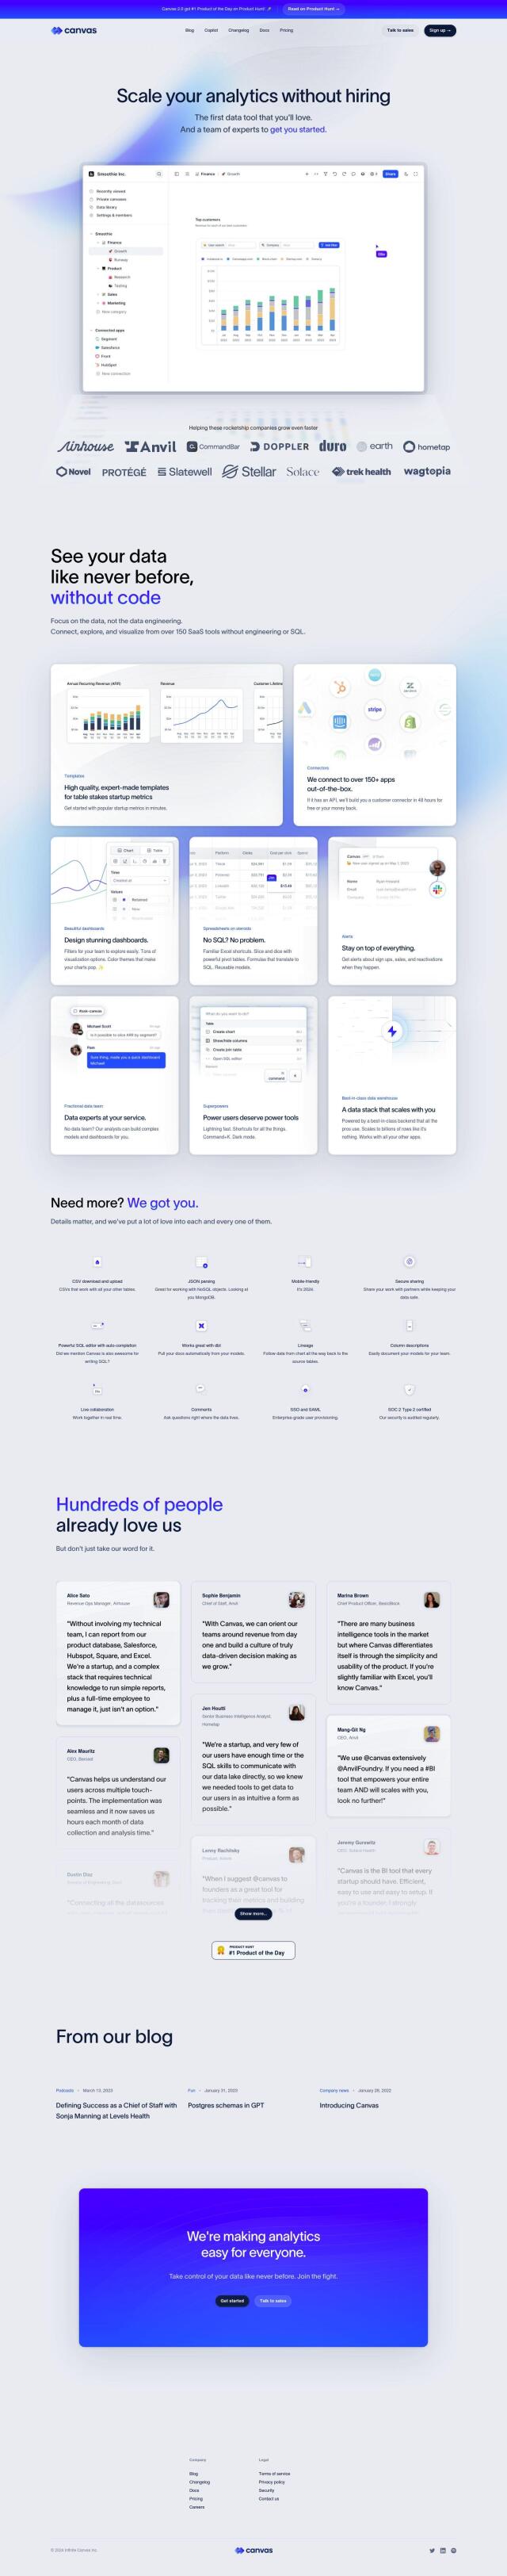
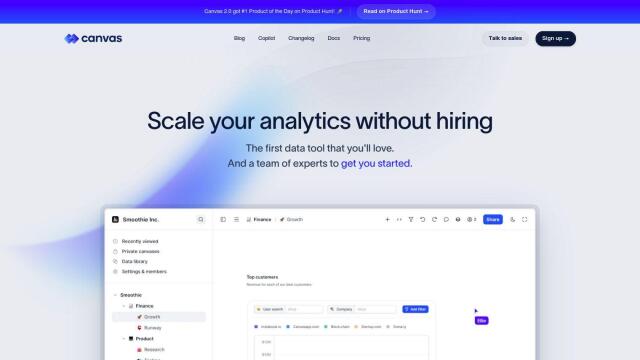
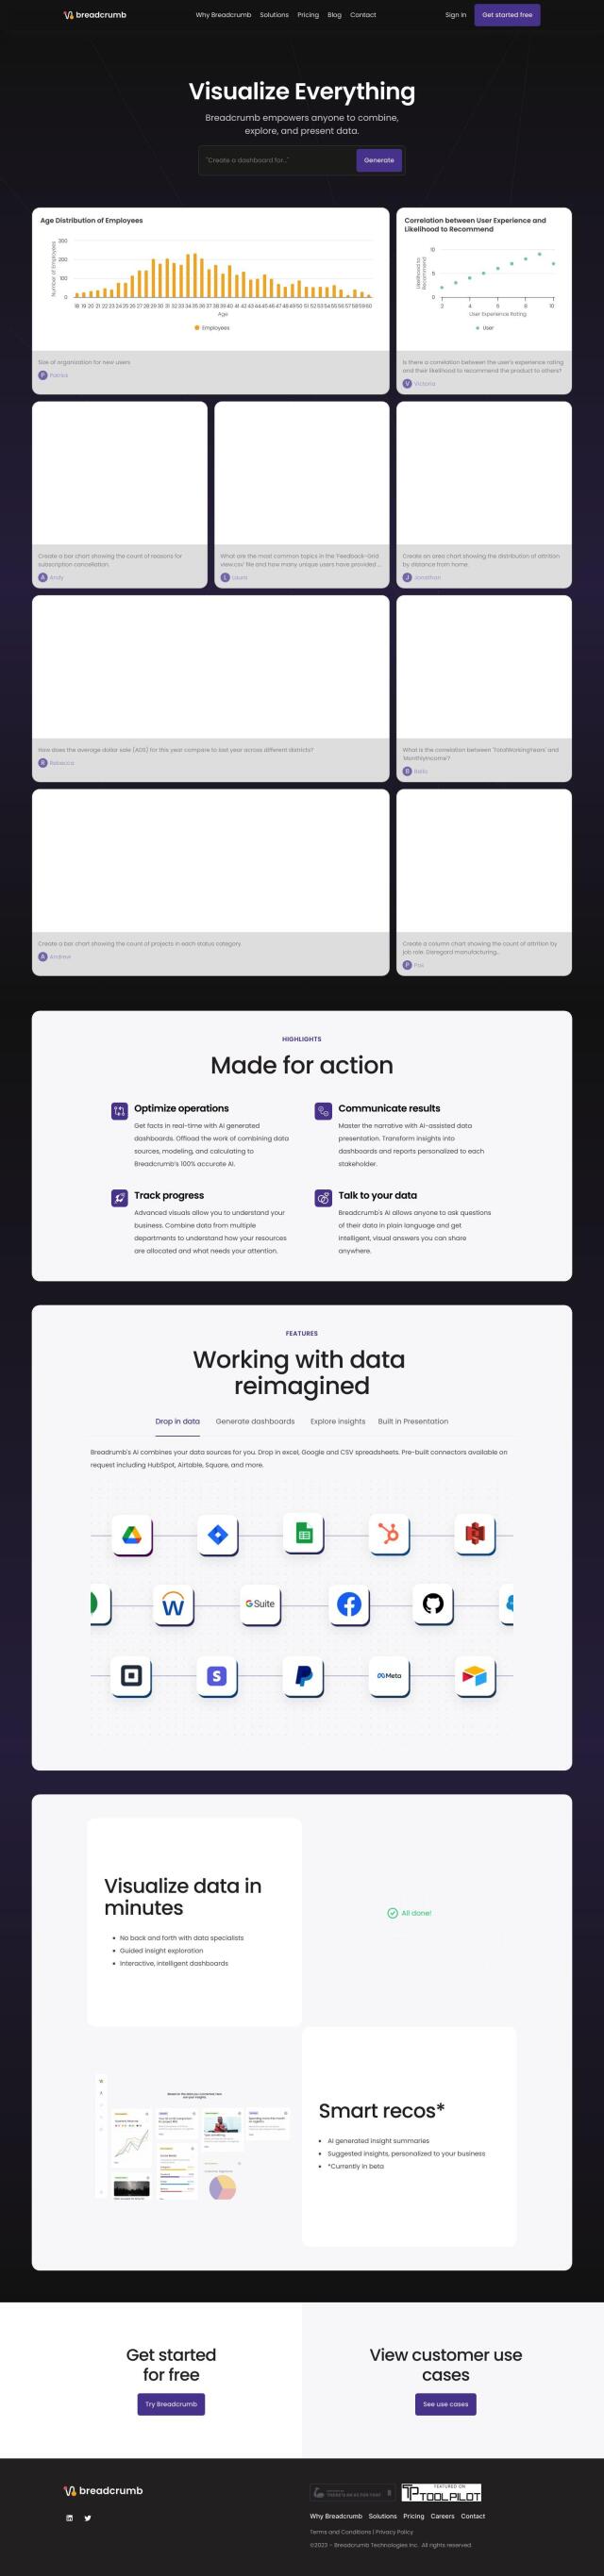
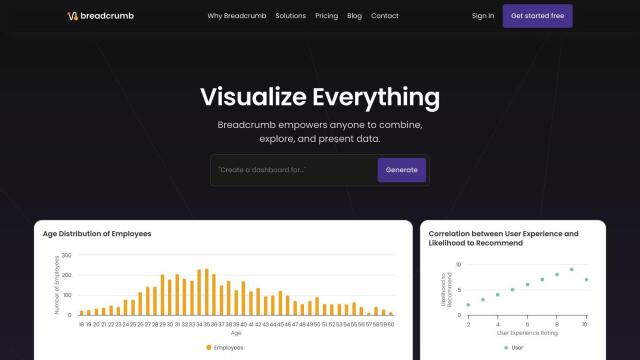
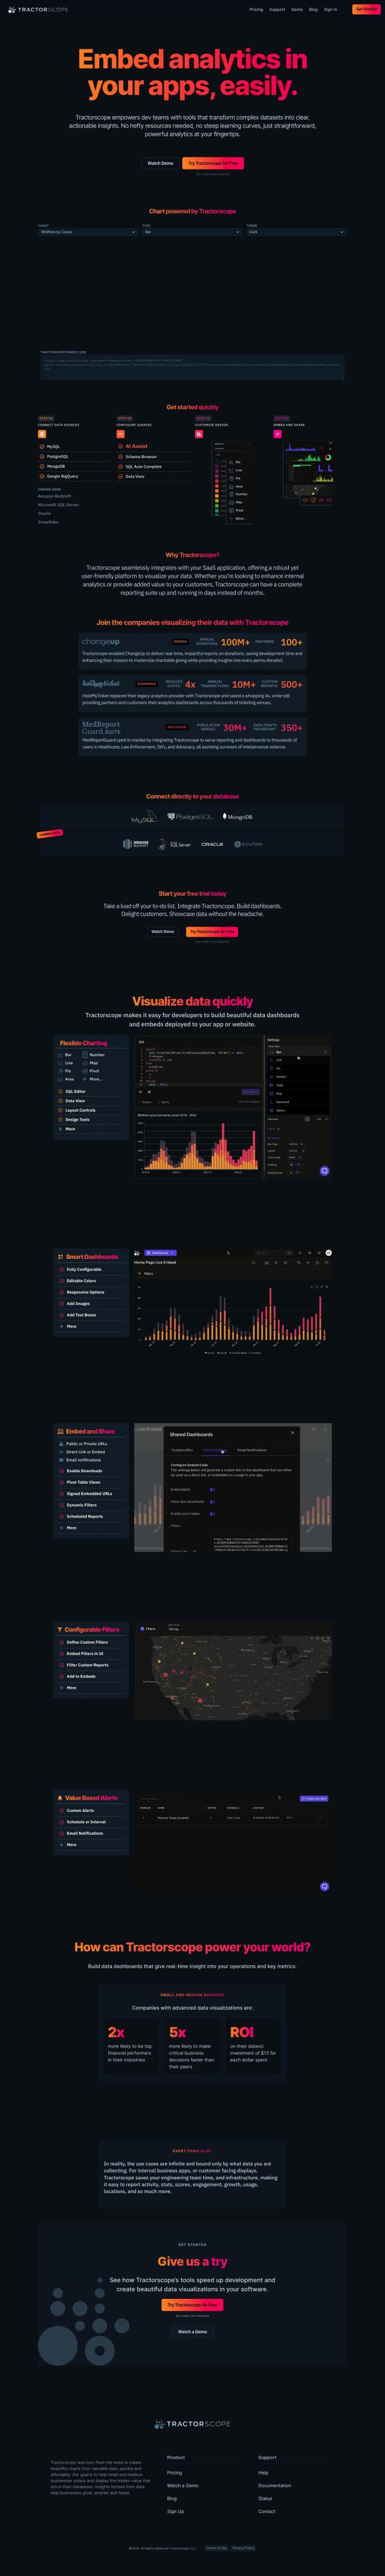
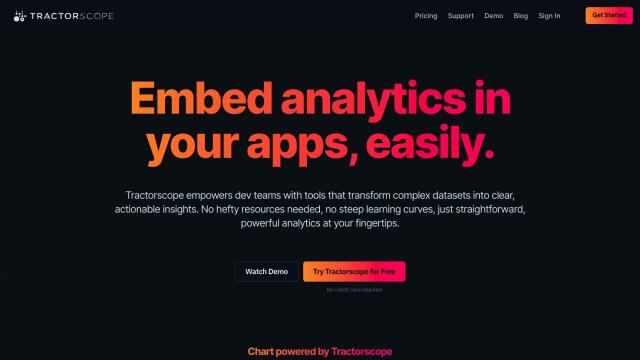
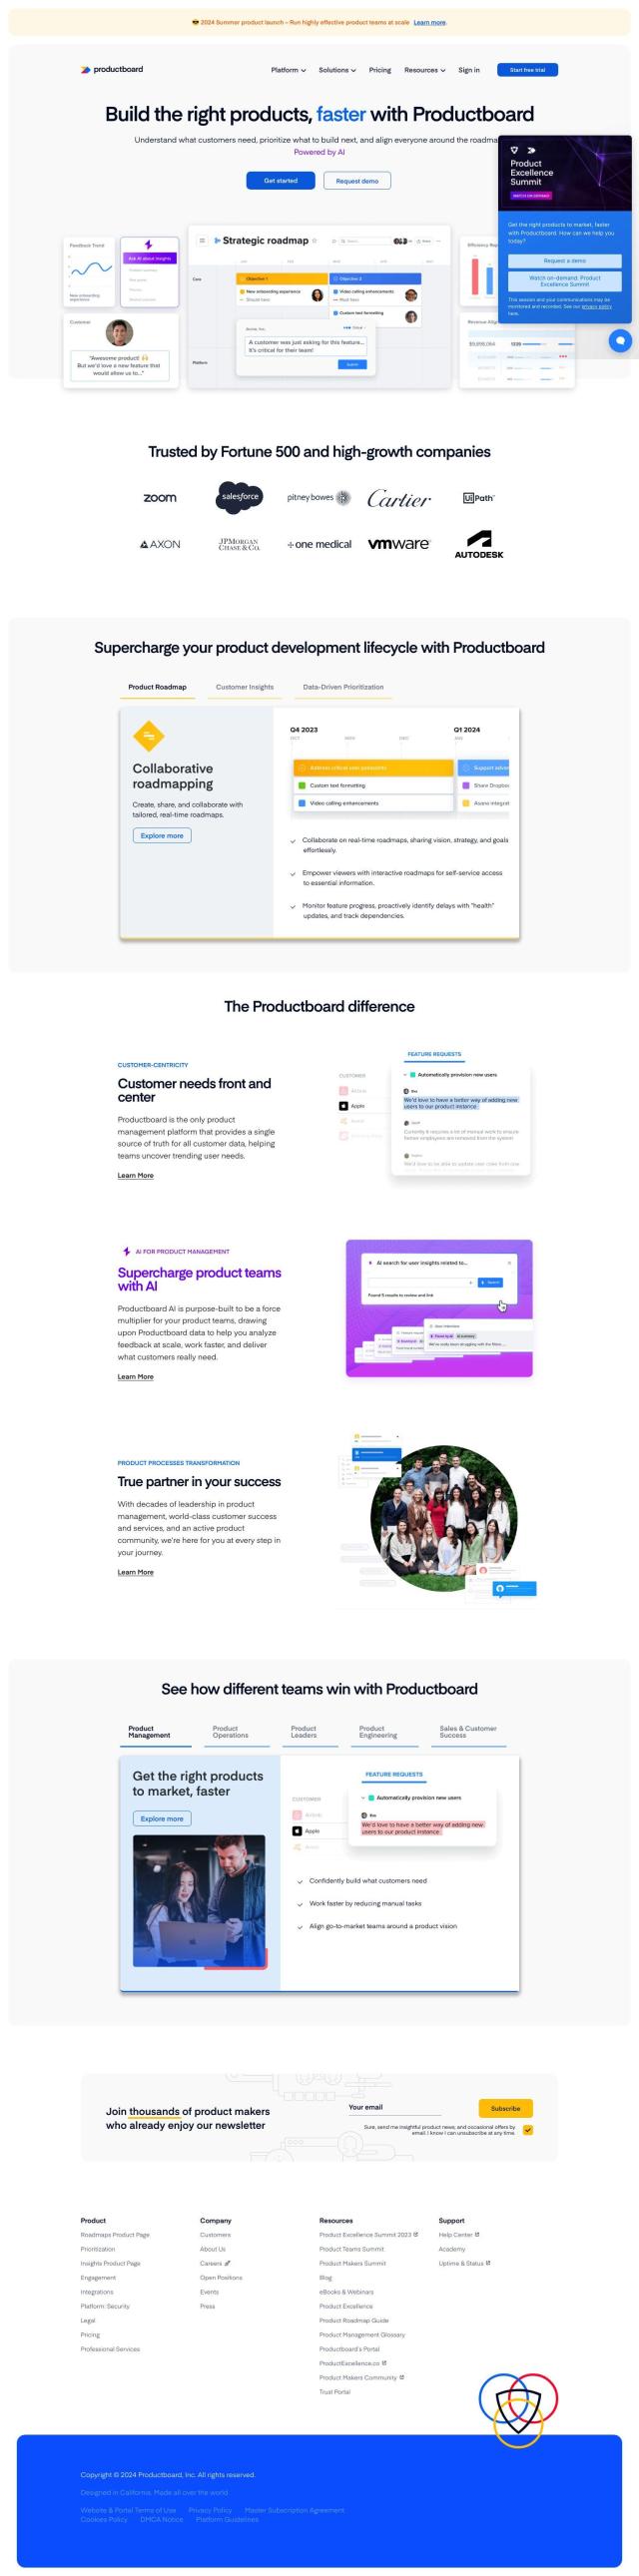
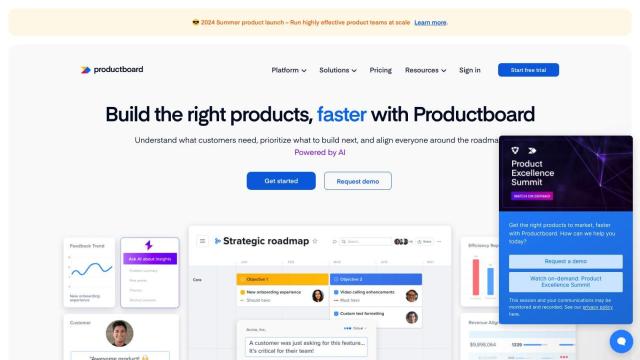
Canvas screenshot thumbnail

Canvas

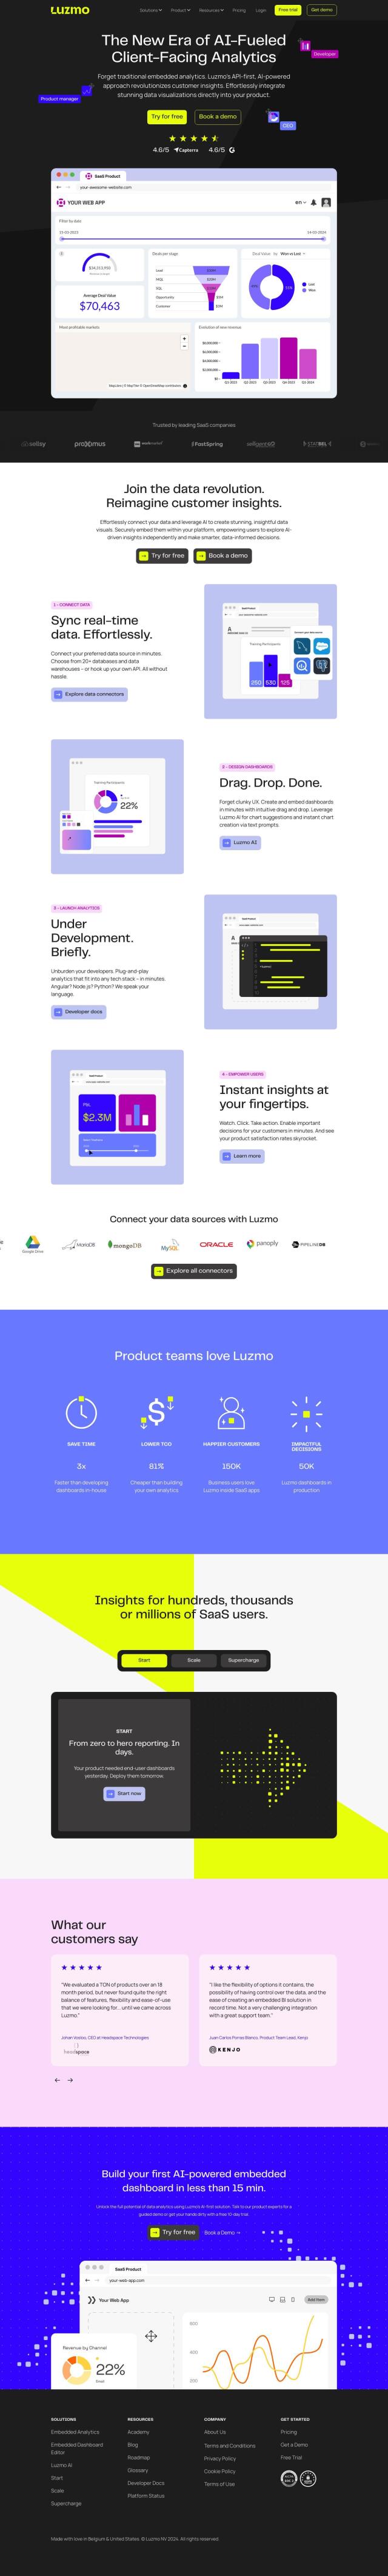
Another strong contender is Canvas, a data tool that makes it easier to connect, explore and visualize data from more than 150 SaaS tools. It's got features like tracking annual recurring revenue (ARR) and other important startup metrics, real-time alerts and the ability to build polished dashboards without programming. Canvas supports multi-user collaboration and integrates with other tools, so it's useful for both technical and nontechnical team members.

Polymer screenshot thumbnail

Polymer

If you want an AI-infused approach, Polymer lets you build dashboards without data science expertise. It's got more than 20 data connectors, including Google Ads and Facebook Ads, and can provide real-time insights through automated dashboard updates. With its AI-powered insights and customizable visualizations, Polymer can help startups get more out of their data.

Onvo screenshot thumbnail

Onvo

Last, Onvo is another AI-infused data visualization tool that lets you build interactive charts and dashboards with a minimum of fuss. It connects to multiple data sources, offers customization options, and lets you share and embed the results. Onvo is good for startups that want to get their work done more efficiently and present data in a more compelling way.

Additional AI Projects

GoodData screenshot thumbnail

GoodData

Quickly build custom data products with interactive analytics abilities, leveraging AI-powered features like a no-code interface and chat assistant for effortless insights.

data.ai screenshot thumbnail

data.ai

Combines data from multiple signals to provide unified insights, enabling fast and confident decision-making across the entire app lifecycle.

Breadcrumb screenshot thumbnail

Breadcrumb

Transform data into interactive AI dashboards, connecting multiple sources, and track trends in real-time with 100% accurate visualizations and natural language queries.

Airbook screenshot thumbnail

Airbook

Accelerate data analysis and insights generation across teams with native connectors to 150+ data sources, collaborative querying, and visualization tools.

Graphy screenshot thumbnail

Graphy

Combine data from multiple sources into interactive, shareable reports in minutes, with AI-powered tools reducing creation time by 80%.

Apptopia screenshot thumbnail

Apptopia

Unlock actionable insights into mobile app performance, advertising, and audience trends with daily-updated data and analytics across multiple sectors.

Luzmo screenshot thumbnail

Luzmo

Add interactive, AI-powered dashboards to SaaS products in weeks, providing real-time insights and self-service analytics for customers.

Explo screenshot thumbnail

Explo

Embed interactive dashboards and self-serve reporting directly into products, enabling end-users to customize analytics experiences and make better decisions.

Vizzly screenshot thumbnail

Vizzly

Build and share interactive, customizable analytics experiences with a no-code dashboard builder, empowering users to explore data without technical hassle.

Tractorscope screenshot thumbnail

Tractorscope

Turn complex data into meaningful insights with customizable dashboards and charts.

Baresquare screenshot thumbnail

Baresquare

Detects anomalies 24/7, automates root cause analysis, and prioritizes actions based on business impact, empowering teams to take swift, data-driven decisions.

Daydream screenshot thumbnail

Daydream

Unify data, context, and team collaboration to drive informed decisions, with AI-powered connections and expert-built templates for instant business insights.

Productboard screenshot thumbnail

Productboard

Automate product development with AI-driven tools, aligning teams with customer needs and streamlining roadmapping, prioritization, and product planning.

Databar screenshot thumbnail

Databar

Connect to 1,000+ APIs without coding, automate workflows, and enrich data in real-time to power business operations across various industries.

Dash screenshot thumbnail

Dash

Build interactive, data-driven applications with Python, deploying and sharing with a single click, and scaling on any cloud infrastructure.

DevDynamics screenshot thumbnail

DevDynamics

Unlock real-time engineering metrics and AI-driven insights to optimize operations, make data-driven decisions, and boost team velocity and productivity.

Chartbeat screenshot thumbnail

Chartbeat

Unlock real-time insights and optimize content in the moment with data-driven recommendations to deliver the best user experience and attract loyal readers.

Lemonado screenshot thumbnail

Lemonado

Build custom business software without coding, leveraging AI-powered tools and drag-and-drop functionality to operationalize data and automate workflows.

Chartonomics screenshot thumbnail

Chartonomics

Convert any data into 20+ chart types with a single click, no setup required, for instant visualization and communication of complex ideas.

Echoes HQ screenshot thumbnail

Echoes HQ

Provides actionable insights into engineering team operations, identifying potential problems and offering recommendations to optimize performance and communication.