Question: I'm looking for an interactive tool to visualize and explore global population density and forest change data.
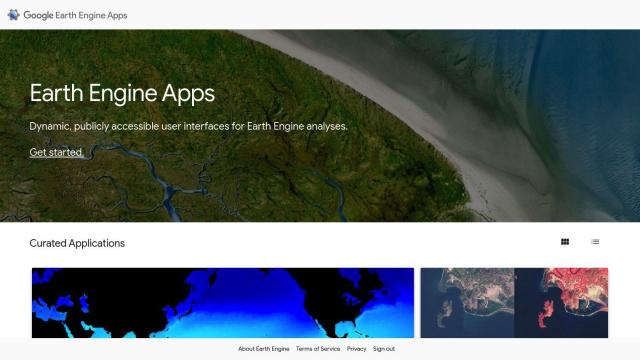
Earth Engine Apps screenshot thumbnail

Earth Engine Apps

For visualizing and exploring global population density and forest change data, a few interactive tools are particularly useful. Earth Engine Apps offers a collection of interactive user interfaces, including the Global Population Explorer and Global Forest Change Explorer. These apps let you visualize and explore GHSL population density estimates for 2015 and Hansen et al.'s global forest change data in Earth Engine.
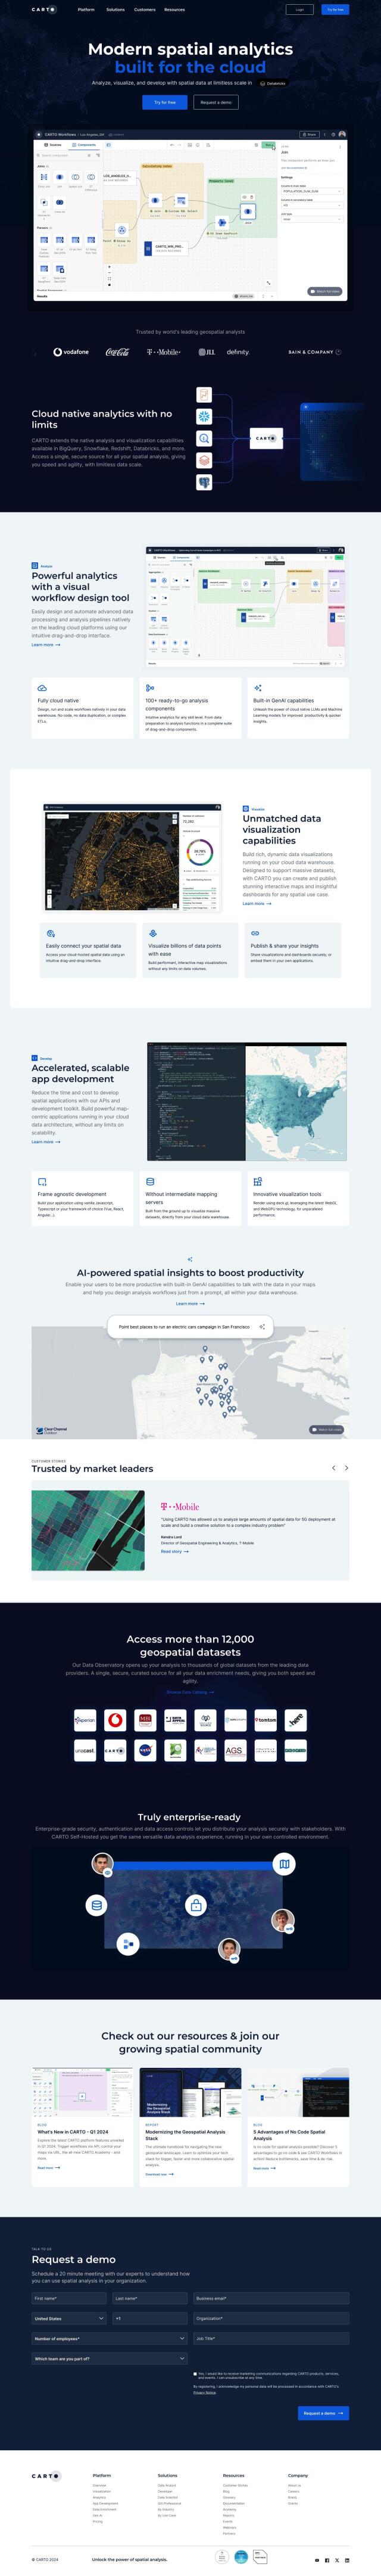
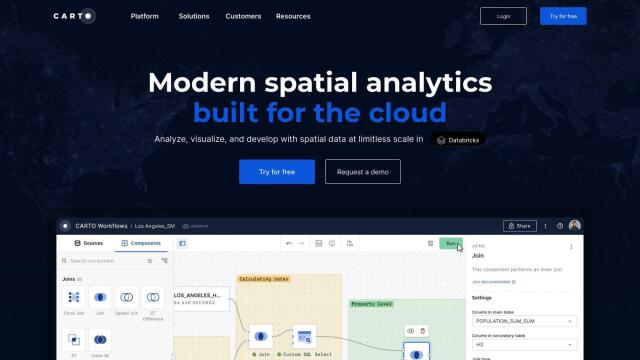
CARTO screenshot thumbnail

CARTO

Another powerful option is CARTO, a cloud-native location intelligence platform. It lets you analyze, visualize and build applications with spatial data at scale. CARTO has a drag-and-drop interface, more than 100 pre-built components, and deep access to geospatial data through the Data Observatory, so it's a good tool for spatial analysis and decision-making.
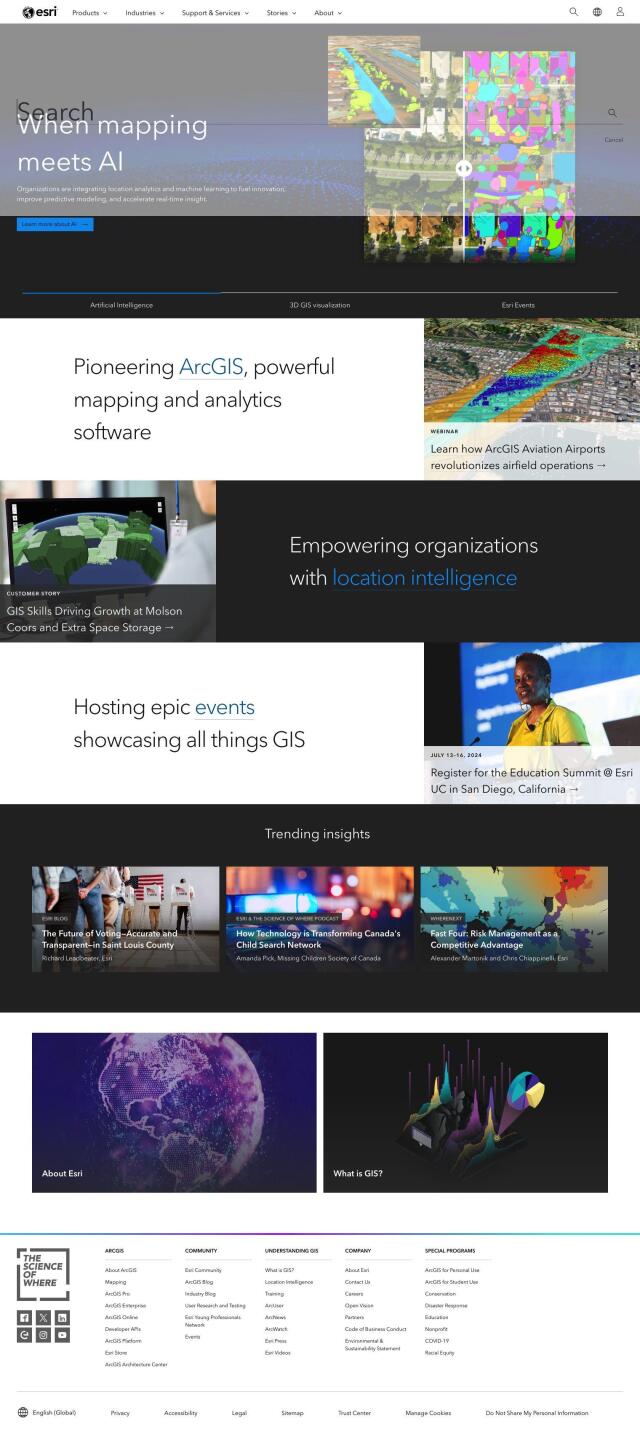
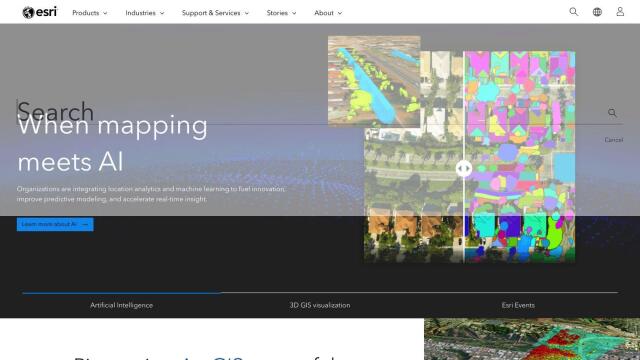
Esri screenshot thumbnail

Esri

Esri also offers a mature GIS mapping software foundation with powerful spatial analysis and location intelligence. It includes tools for 3D visualization, spatial analysis and real-time decision-making. Esri's technology is broadly applicable to many industries, including infrastructure planning and climate action, and can be deployed in the cloud or on premises.
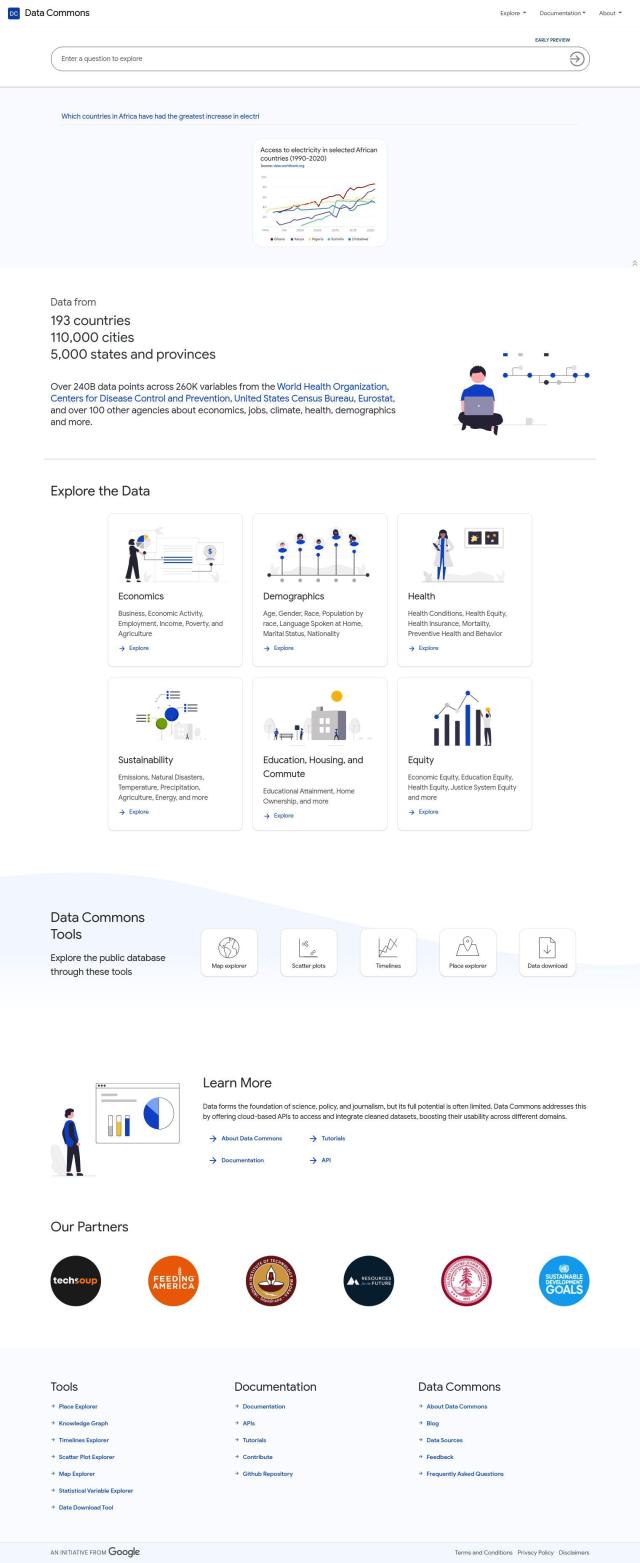
Data Commons screenshot thumbnail

Data Commons

For those who want a centralized data repository, Data Commons pools data from more than 193 countries and offers tools to explore demographic, economic and environmental data. With a map explorer and other interactive tools, you can drill down to visualize and analyze data in detail, drawing from sources like the World Health Organization and the United States Census Bureau.

Additional AI Projects

EOSDA screenshot thumbnail

EOSDA

Utilizes satellite data and machine learning to provide actionable insights for sustainable agriculture and forestry, enabling data-driven decision making and reduced waste.

Mapbox screenshot thumbnail

Mapbox

Create customizable, interactive maps with live-updating data and advanced navigation features for web, mobile, automotive, and AR applications.

Streamlit screenshot thumbnail

Streamlit

Build interactive data apps with a few lines of code, and deploy instantly with a single click, without needing front-end programming expertise.

Tableau screenshot thumbnail

Tableau

Connect to any data source, create visualizations, and share insights with an intuitive, AI-infused analytics platform that drives better decision-making.

Nearmap screenshot thumbnail

Nearmap

Transforms high-resolution aerial imagery into actionable insights with AI predictions, 3D modeling, and geospatial tools for informed business decisions.

Textomap screenshot thumbnail

Textomap

Automatically extracts locations from text-based content to create interactive maps in seconds, saving time and effort.

Unearth Insights screenshot thumbnail

Unearth Insights

Access a unified suite of location data and analytics tools, powered by an AI co-pilot, to uncover insights and drive business decisions faster.

Spotfire screenshot thumbnail

Spotfire

Integrate, prepare, analyze, and act on data from multiple sources with a single platform for real-time data exploration and point-and-click data science.

Spotfire screenshot thumbnail

Spotfire

Combines self-service data visualization and advanced data science in a single workflow, empowering users to connect, analyze, and act on data for better business outcomes.

GoodData screenshot thumbnail

GoodData

Quickly build custom data products with interactive analytics abilities, leveraging AI-powered features like a no-code interface and chat assistant for effortless insights.

Rapid Editor screenshot thumbnail

Rapid Editor

Automates map creation and updates using machine learning and satellite imagery, reducing manual effort and increasing accuracy.

Spatial.ai screenshot thumbnail

Spatial.ai

Unlock deeper customer insights with behavioral segmentation tools, profiling social, mobile, and web behavior to inform targeted marketing and location strategies.

Jeda.ai screenshot thumbnail

Jeda.ai

Collaborative, interactive canvas for creating, visualizing, and analyzing data, turning ideas into beautiful visuals and insights with advanced generative AI capabilities.

Hex screenshot thumbnail

Hex

Unify data teams with AI-assisted exploration, collaboration, and interactive reporting, accelerating data work and improving accuracy in a single, modular workspace.

Piktochart screenshot thumbnail

Piktochart

Create professional-looking designs without design skills, leveraging a drag-and-drop editor, data visualization, and customization options to produce engaging visual content.

Embeddable screenshot thumbnail

Embeddable

Craft compelling customer-facing analytics experiences and embed them directly into your application, with full control and flexibility, in a fraction of the time.

ePlant screenshot thumbnail

ePlant

Remotely monitor tree health and environmental conditions with long-range wireless sensors, tracking growth, stress, and weather patterns for data-driven decisions.

The Visualizer screenshot thumbnail

The Visualizer

Converts complex information into visually engaging mind maps, enabling faster comprehension and retention of ideas, with less mental energy expenditure.

Mappedin screenshot thumbnail

Mappedin

Create interactive 3D indoor maps with AI-assisted tools, automated navigation, and content enrichment, and share them across various devices and formats.

PTV Group screenshot thumbnail

PTV Group

Analyze and optimize traffic infrastructure with data, AI, and machine learning to identify problems and potential improvements.