Question: I'm looking for a tool that can help me generate reports from Excel data with easily editable charts.
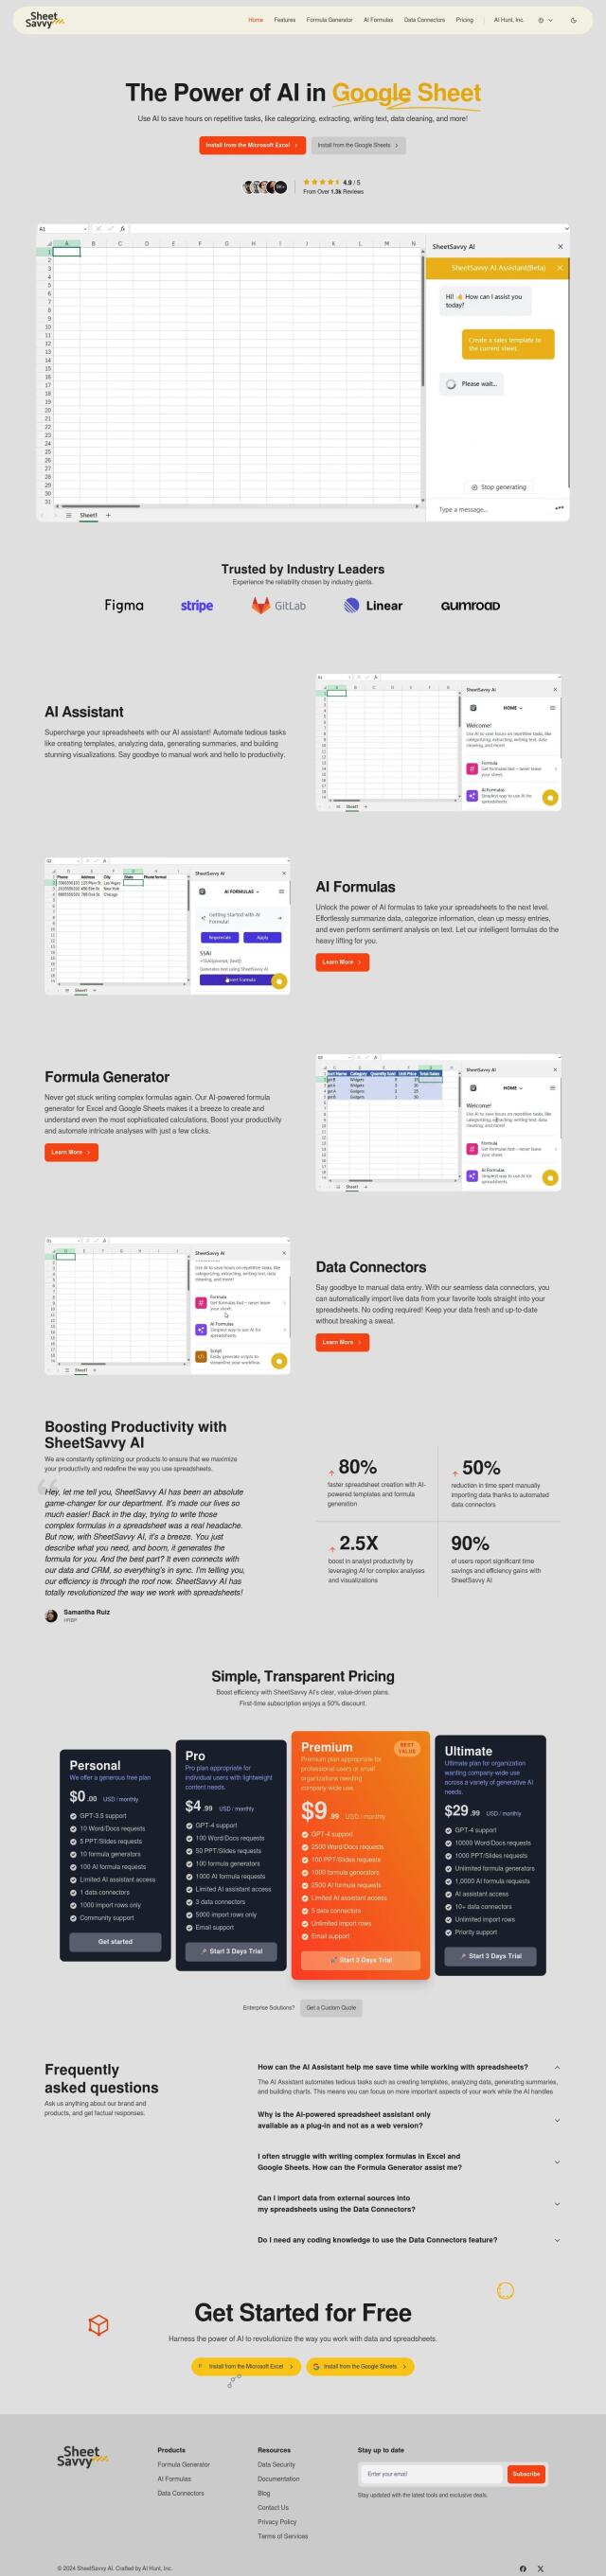
ExcelDashboardAI screenshot thumbnail

ExcelDashboardAI

If you need a tool to create reports from Excel data with charts that are easy to edit, ExcelDashboardAI is a top contender. The service lets you turn Excel files into interactive data visualization dashboards and analysis reports, with abilities like batch analysis, custom dashboards and natural language instant insights. It's geared for well-prepared data and offers a range of pricing plans for different customers.

Ajelix screenshot thumbnail

Ajelix

Another strong contender is Ajelix, a data analytics service that combines Excel Formula Generation, AI tools and business intelligence. Ajelix has a range of productivity tools, including an Excel Formula Generator and an AI Spreadsheet Assistant, to help you automate tasks and create dashboards. It can handle a variety of data sources and offers self-service BI tools to quickly create charts and graphs.
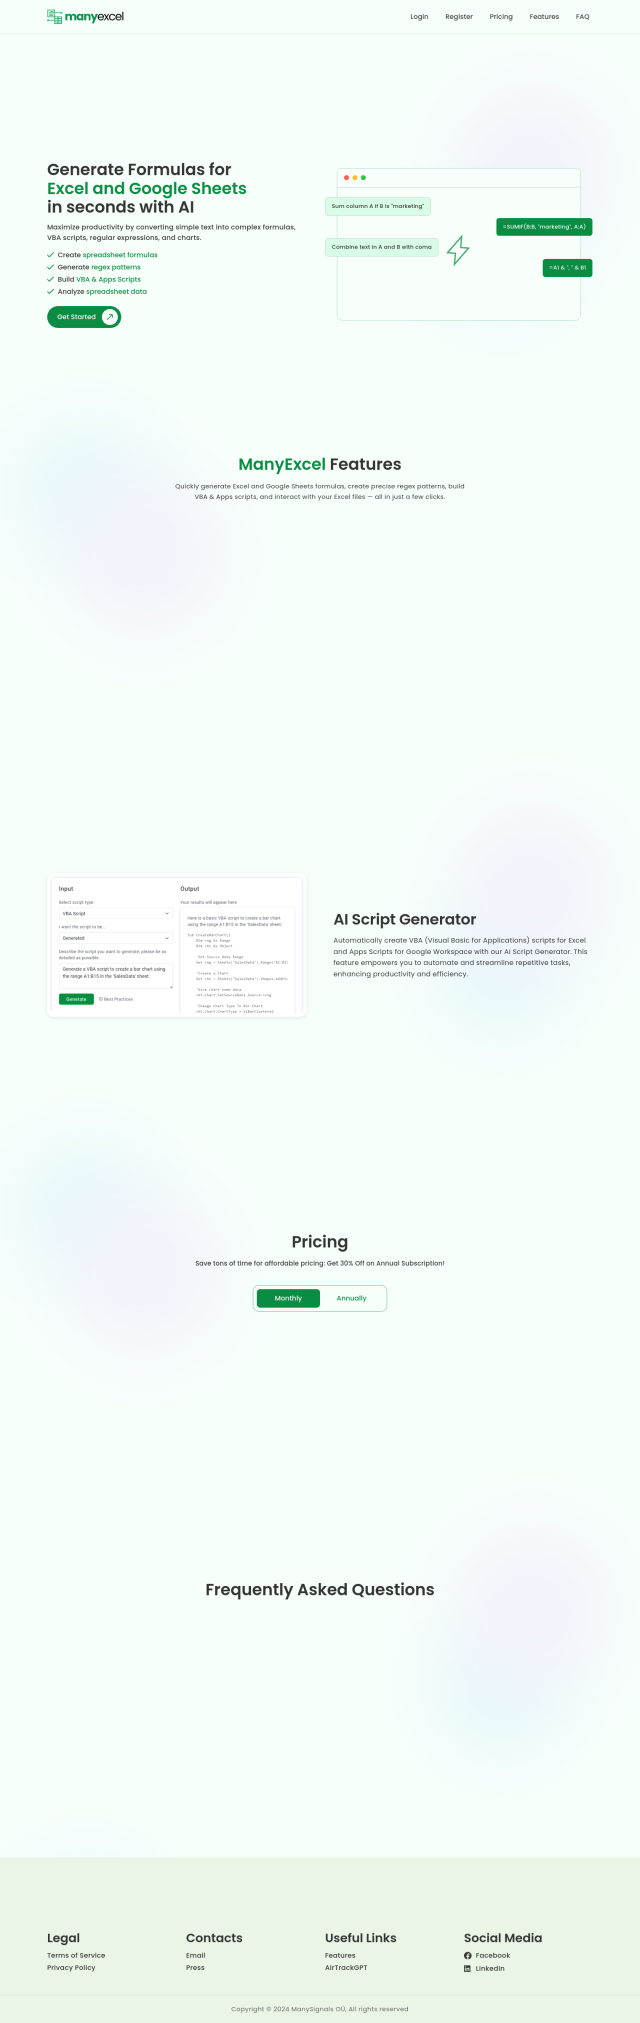
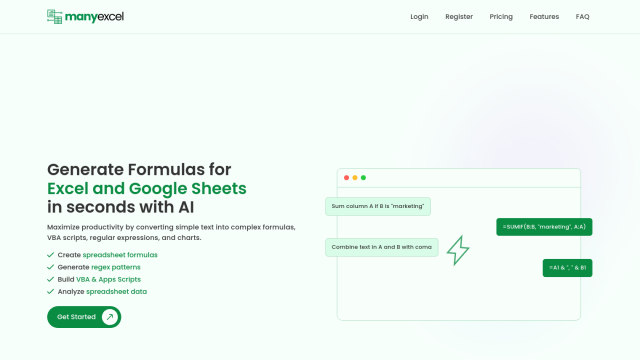
Formula Bot screenshot thumbnail

Formula Bot

If you prefer a more general-purpose approach, Formula Bot is an AI-powered service that turns text into a variety of outputs, including Excel formulas and SQL queries. It includes tools like an Excel Formula Generator and a Data Analyzer so you can create charts and analysis without writing programming code. Formula Bot can handle a variety of data sources and can automate spreadsheet tasks with AI so data analysis is more accessible.

ChartFast screenshot thumbnail

ChartFast

Last, ChartFast is an AI-powered service to speed up data visualization and analysis. It automates tasks like data cleaning and normalization so you can create complex graphs and other visualizations more easily. With customizable visualization code and interactive data queries, ChartFast is good for large data sets that you need to process carefully and quickly.

Additional AI Projects

SheetSavvy AI screenshot thumbnail

SheetSavvy AI

Automates complex tasks, writes formulas, and integrates with various data sources to increase productivity and make data analysis faster and more collaborative.

ManyExcel screenshot thumbnail

ManyExcel

Generates formulas, regex patterns, and scripts in seconds, turning plain text into complex Excel and Google Sheets solutions with explanatory insights.

ExtendOffice screenshot thumbnail

ExtendOffice

Optimizes Microsoft Office applications with AI-powered tools, adding features like tabbed interfaces, advanced Excel functions, and AI-driven content refinement and summarization.

Spreadsheet.com screenshot thumbnail

Spreadsheet.com

Combines spreadsheet interface with automation, customizable views, and integrations to streamline project management, data tracking, and team collaboration.

Image Charts screenshot thumbnail

Image Charts

Automatically create custom charts from data, including line, pie, and scatter charts, with branding and embedding options for seamless integration.

Onvo screenshot thumbnail

Onvo

Create interactive charts and insights with simple AI prompts, eliminating the need for complex queries and customizations.

Tabula screenshot thumbnail

Tabula

Automate data workflows, standardize disparate sources, and gain real-time insights without coding, empowering data-driven decision-making across departments.

Chartonomics screenshot thumbnail

Chartonomics

Convert any data into 20+ chart types with a single click, no setup required, for instant visualization and communication of complex ideas.

OWOX BI screenshot thumbnail

OWOX BI

Connects corporate data and spreadsheets, enabling better business insights and decisions through automated reporting, data blending, and collaborative access.

AI Excel Bot screenshot thumbnail

AI Excel Bot

Create complex Excel formulas with simple English prompts, and get explanations for formulas you don't understand, saving you time and hassle.

Graphy screenshot thumbnail

Graphy

Combine data from multiple sources into interactive, shareable reports in minutes, with AI-powered tools reducing creation time by 80%.

ChartAI screenshot thumbnail

ChartAI

Generate various charts and diagrams, including pie charts, flowcharts, and mind maps, from entire data sets with a user-friendly, ChatGPT-like interface.

Skills.ai screenshot thumbnail

Skills.ai

Generate data-infused articles, reports, and presentations without coding, leveraging AI-driven analytics to turn data into actionable insights in minutes.

Polymer screenshot thumbnail

Polymer

Converts complex data into intuitive, actionable visualizations, linking multiple sources and generating real-time insights with AI-driven analytics and suggested trends.

Retable screenshot thumbnail

Retable

Unify data, spreadsheets, and workflows in one place, leveraging AI to augment data and gain insights, with customizable views and automation.

Hex screenshot thumbnail

Hex

Unify data teams with AI-assisted exploration, collaboration, and interactive reporting, accelerating data work and improving accuracy in a single, modular workspace.

Lido screenshot thumbnail

Lido

Automate tasks and workflows in Google Sheets without programming skills, extracting data and pushing it to email, Slack, calendars, and other destinations.

AskCSV screenshot thumbnail

AskCSV

Analyze CSV files in-browser, with AI-driven insights, chart creation, and data visualization, while maintaining complete control and privacy over your data.

Sheeter screenshot thumbnail

Sheeter

Automates complex Excel formulas with an intuitive interface, generating powerful and flexible formulas for Excel and Google Sheets with ease.

Canvas screenshot thumbnail

Canvas

Link, query, and visualize data from 150+ SaaS tools without coding, empowering non-technical teams to make data-informed decisions.