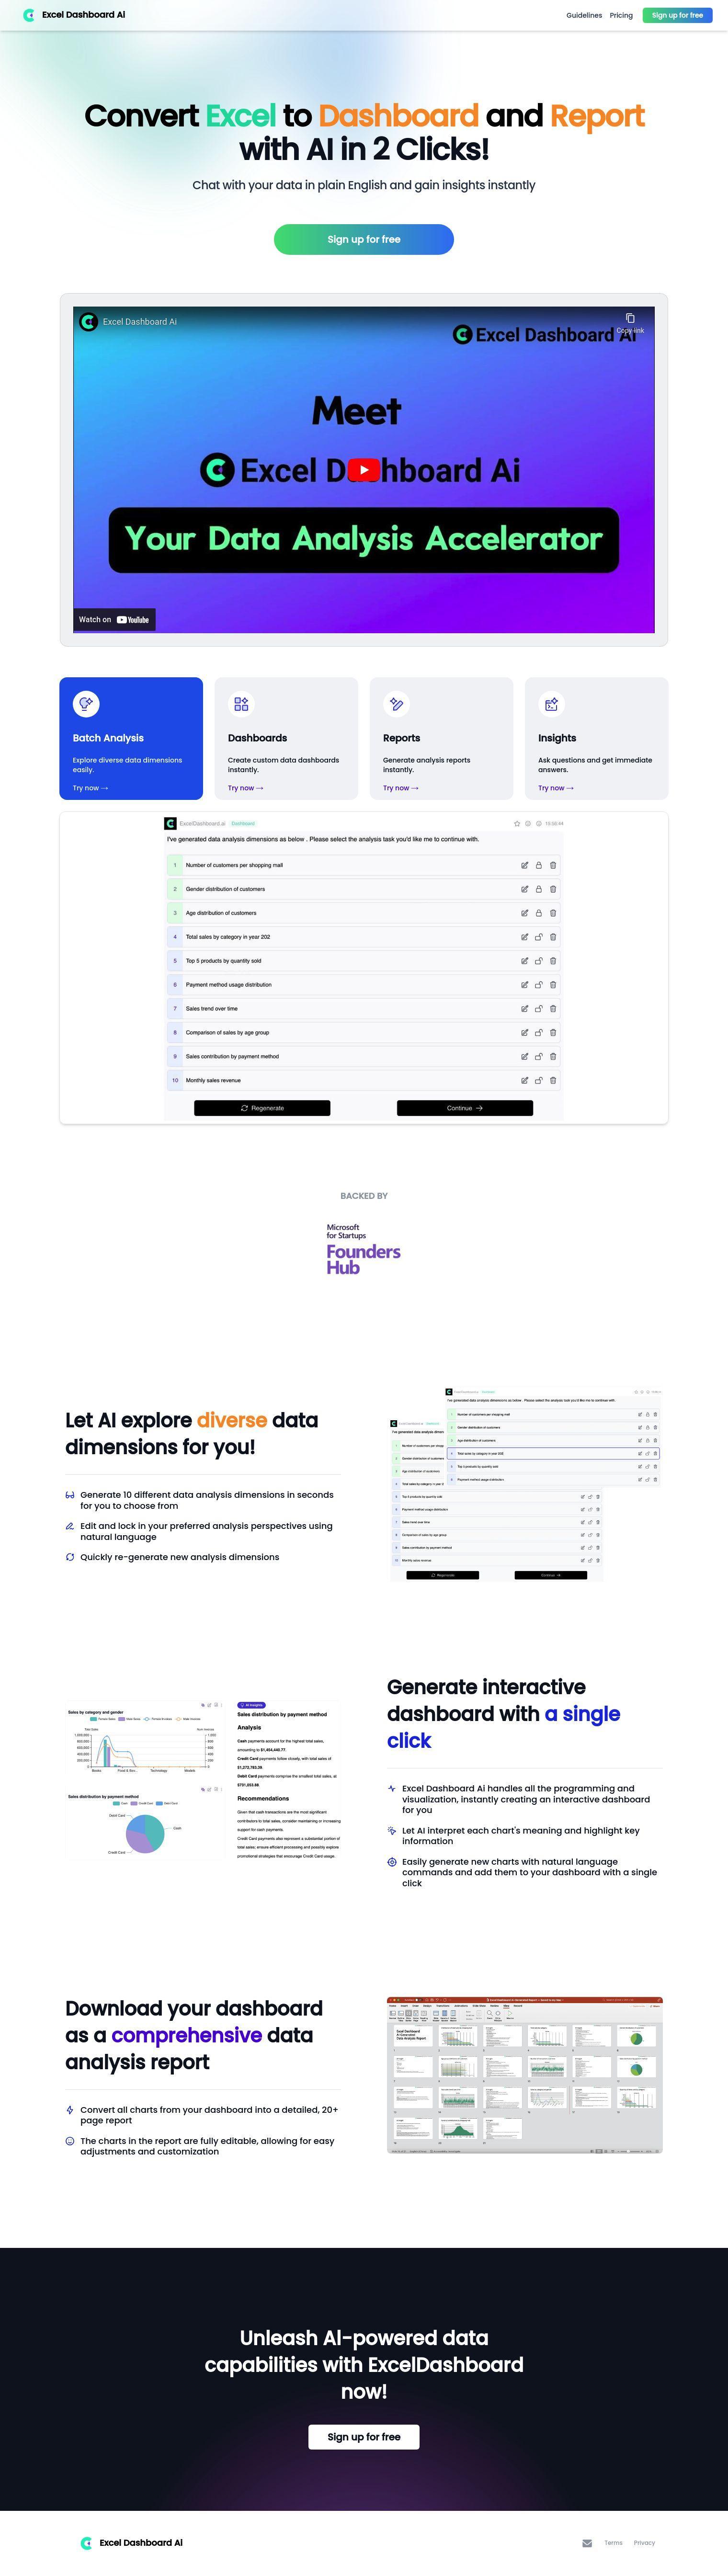

ExcelDashboardAI is a tool that lets you turn Excel spreadsheets into data dashboards and analysis reports. It offers a range of features to help you explore data, including batch analysis, custom dashboards and reports, and natural language instant insights.
Among its features:
- Convert Excel files to dashboards and reports: Turn Excel data into interactive data dashboards and reports in seconds.
- Batch Analysis: Explore different data dimensions with ease.
- Interactive Dashboards: Create and update charts with natural language prompts.
- Reports: Generate reports with fully editable charts.
- Insights: Ask questions and get answers.
The tool works best with well-structured data, like spreadsheets that are clean and neatly tabulated. It can be finicky with more complex spreadsheets or irregular formatting.
The tool has a few pricing tiers to suit different needs:
- Free: Good for casual use, with 400 AI credits, basic models and the ability to upload one data file with up to 20 columns.
- Plus: Good for personal use, with 1500 AI credits, premium models and the ability to upload five data files with up to 30 columns per file, for $19 per month.
- Pro: Good for professionals, with 6000 AI credits, the ability to upload unlimited data files and priority support, for $49 per month.
Sign up for free to get started with ExcelDashboardAI and start getting data-driven insights and making data-driven decisions.
Published on July 26, 2024
Related Questions
Can I find a tool that converts Excel spreadsheets into interactive dashboards and reports? I need a way to analyze large datasets in Excel, do you know of any tools that can help? Is there a solution that lets me ask questions about my data and get instant answers? I'm looking for a tool that can help me generate reports from Excel data with easily editable charts.
Tool Suggestions
Analyzing ExcelDashboardAI...