Question: Can I find a tool that converts Excel spreadsheets into interactive dashboards and reports?

ExcelDashboardAI screenshot thumbnail

ExcelDashboardAI

ExcelDashboardAI is an excellent choice. It allows you to turn Excel files into interactive visual data dashboards and analysis reports. The system offers batch analysis, custom dashboards, and reports, along with natural language instant insights, making it ideal for exploring different dimensions of data. It has three pricing tiers, including a free plan with 400 AI credits, making it accessible for various user requirements.
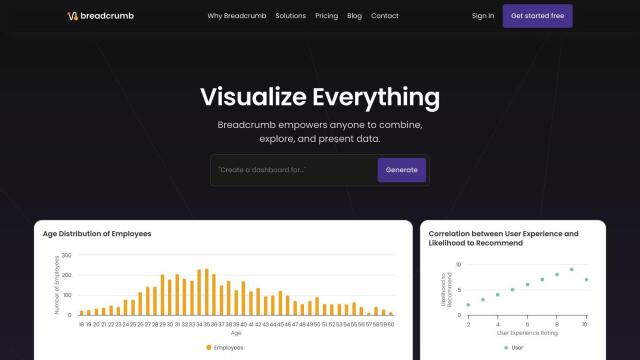
Breadcrumb screenshot thumbnail

Breadcrumb

Another great tool is Breadcrumb, which turns data and spreadsheets into AI-powered dashboards. It supports multiple data sources including Excel, Google Sheets, and CSV files, and offers real-time optimization, AI-generated narratives, and advanced visualizations. The platform includes features like plain language querying and guided insight exploration, making it user-friendly without needing data expertise.

Polymer screenshot thumbnail

Polymer

For a more comprehensive solution, consider Polymer. This platform automates the creation of complex data insights, integrates multiple data sources, and provides real-time dashboard updates. With over 20 data connectors, including Google Ads and Google Sheets, Polymer makes it easy to analyze and visualize data without needing data science expertise. It also offers pre-built templates and customization options, making it suitable for various business use cases.

Additional AI Projects

Spreadsheet.com screenshot thumbnail

Spreadsheet.com

Combines spreadsheet interface with automation, customizable views, and integrations to streamline project management, data tracking, and team collaboration.

Ajelix screenshot thumbnail

Ajelix

Automate tasks, create formulas, and build dashboards with ease using AI-powered spreadsheet tools and a self-service BI platform.

Domo screenshot thumbnail

Domo

Unifies data from any source, providing AI-driven insights and automation to drive real-time decisions and meaningful actions across the organization.

Onvo screenshot thumbnail

Onvo

Create interactive charts and insights with simple AI prompts, eliminating the need for complex queries and customizations.

GoodData screenshot thumbnail

GoodData

Quickly build custom data products with interactive analytics abilities, leveraging AI-powered features like a no-code interface and chat assistant for effortless insights.

Luminal screenshot thumbnail

Luminal

Automate complex spreadsheet tasks up to 10 times faster with AI-driven cleaning, transformation, and analysis, using natural language prompts.

Tabula screenshot thumbnail

Tabula

Automate data workflows, standardize disparate sources, and gain real-time insights without coding, empowering data-driven decision-making across departments.

Mode screenshot thumbnail

Mode

Unify data analysis and visualization with SQL, R, Python, and interactive dashboards to accelerate insights and collaboration across teams.

OWOX BI screenshot thumbnail

OWOX BI

Connects corporate data and spreadsheets, enabling better business insights and decisions through automated reporting, data blending, and collaborative access.

SheetSavvy AI screenshot thumbnail

SheetSavvy AI

Automates complex tasks, writes formulas, and integrates with various data sources to increase productivity and make data analysis faster and more collaborative.

Formula Bot screenshot thumbnail

Formula Bot

Turns text into various outputs, including Excel formulas, SQL queries, and more, to accelerate data analysis and spreadsheet workflows.

Causal screenshot thumbnail

Causal

Build financial models by connecting to multiple data sources, and analyze your business with human-readable formulas and granular permissions.

Graphy screenshot thumbnail

Graphy

Combine data from multiple sources into interactive, shareable reports in minutes, with AI-powered tools reducing creation time by 80%.

Hex screenshot thumbnail

Hex

Unify data teams with AI-assisted exploration, collaboration, and interactive reporting, accelerating data work and improving accuracy in a single, modular workspace.

Canvas screenshot thumbnail

Canvas

Link, query, and visualize data from 150+ SaaS tools without coding, empowering non-technical teams to make data-informed decisions.

Explo screenshot thumbnail

Explo

Embed interactive dashboards and self-serve reporting directly into products, enabling end-users to customize analytics experiences and make better decisions.

Decipad screenshot thumbnail

Decipad

Combine data, formulas, and text into interactive notebooks, bridging the gap between analysis and storytelling with easy-to-understand models and real-time data updates.

Vizzly screenshot thumbnail

Vizzly

Build and share interactive, customizable analytics experiences with a no-code dashboard builder, empowering users to explore data without technical hassle.

ManyExcel screenshot thumbnail

ManyExcel

Generates formulas, regex patterns, and scripts in seconds, turning plain text into complex Excel and Google Sheets solutions with explanatory insights.

GRID screenshot thumbnail

GRID

Convert spreadsheets into interactive website calculators and lead-gen tools without coding, capturing leads and converting visitors into customers.

Blaze SQL screenshot thumbnail

Blaze SQL

Ask a question, get instant data insights with automated SQL queries, charts, and dashboards, no coding required.