Question: Can you suggest a platform that allows me to create custom visualizations and dashboards for my text data?

MonkeyLearn screenshot thumbnail

MonkeyLearn

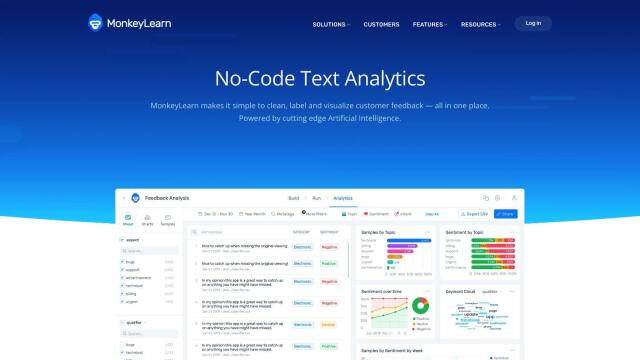
If you want to build your own custom visualizations and dashboards for your text data, MonkeyLearn is a good choice. This no-code text analytics tool lets you clean, label and visualize customer feedback with AI, giving you instant insights with customizable charts and visualizations. It integrates with lots of apps and BI tools, too, so you can get a complete package for sentiment analysis, entity extraction and topic classification.

Polymer screenshot thumbnail

Polymer

Another good option is Polymer, an AI-powered dashboard creation tool. It automatically transforms complex data into insights you can act on and can tie together lots of data sources. You can create dashboards fast without needing data science or engineering skills, with features like AI-driven insights, personalized visualization and easy sharing and collaboration.

Vizzly screenshot thumbnail

Vizzly

If you need something that's super customizable, Vizzly offers a no-code builder for interactive analytics dashboards. The platform lets you build data-driven experiences with a low technical burden so you can quickly deploy and customize dashboards. It also offers self-serve reporting, data modeling and native SDK-based embedding, so it's a good choice for SaaS companies.

Monitr screenshot thumbnail

Monitr

Last, Monitr offers a cloud-based data visualization and analytics service that can tie together data from many sources. It lets you create charts and dashboards, collaborate on SQL queries and use AI-based analytics tools. Monitr's free tier is pretty generous, with unlimited database connections and dashboards, so it's a good option for a broad range of users.
Additional AI Projects

Vizly screenshot thumbnail

Vizly

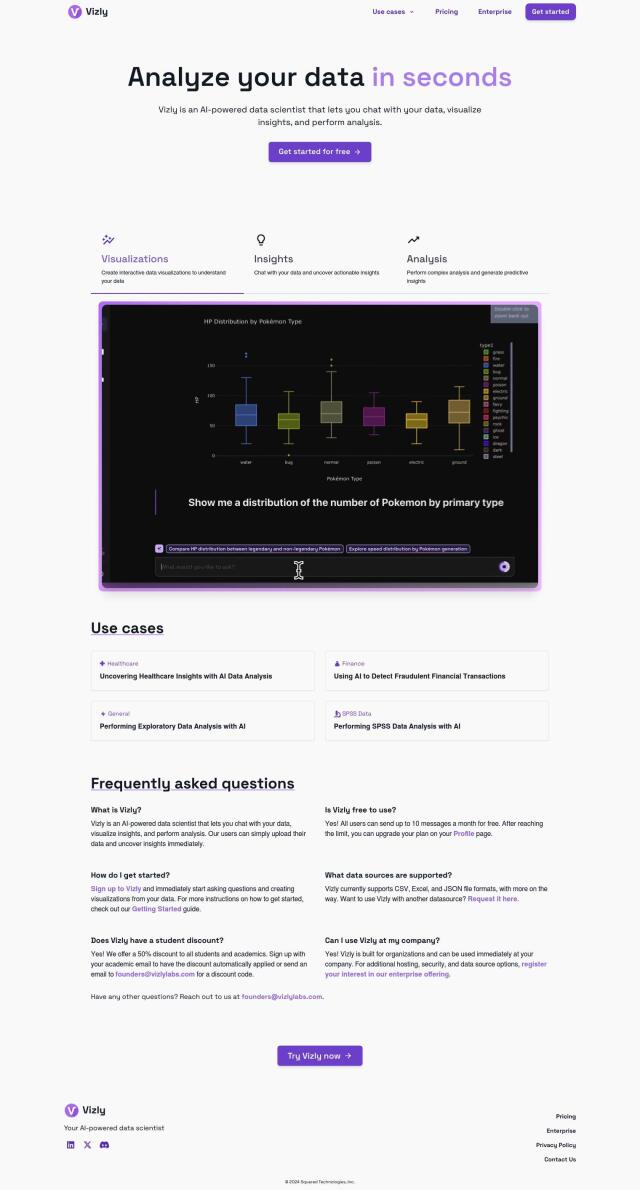
Interactively analyze data by asking questions, visualizing results, and performing advanced analysis to uncover insights and predictions.
Onboard Email screenshot thumbnail

Onboard Email

Automatically segments customers, optimizes inbox placement, and composes personalized emails for every interaction, driving engagement and conversions.

Explo screenshot thumbnail

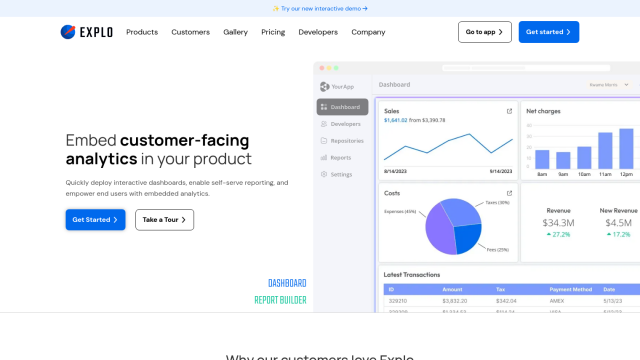
Explo

Embed interactive dashboards and self-serve reporting directly into products, enabling end-users to customize analytics experiences and make better decisions.

Airbook screenshot thumbnail

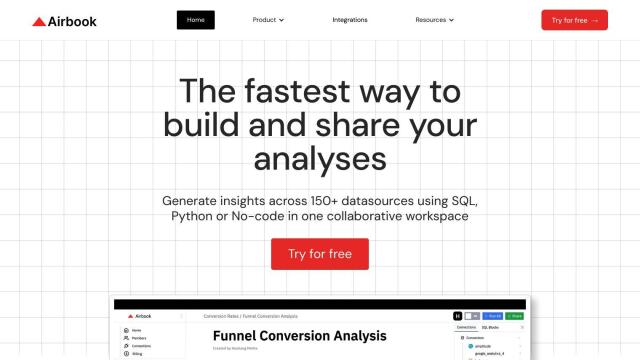
Airbook

Accelerate data analysis and insights generation across teams with native connectors to 150+ data sources, collaborative querying, and visualization tools.

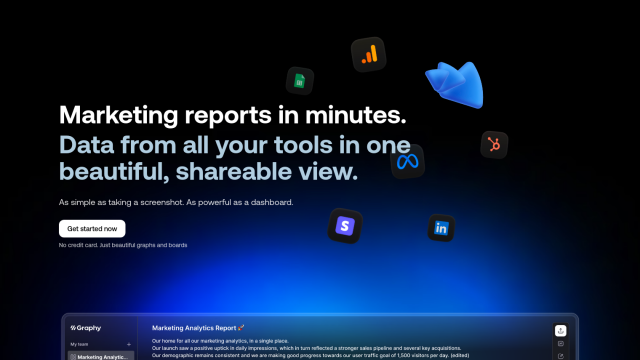
Graphy screenshot thumbnail

Graphy

Combine data from multiple sources into interactive, shareable reports in minutes, with AI-powered tools reducing creation time by 80%.

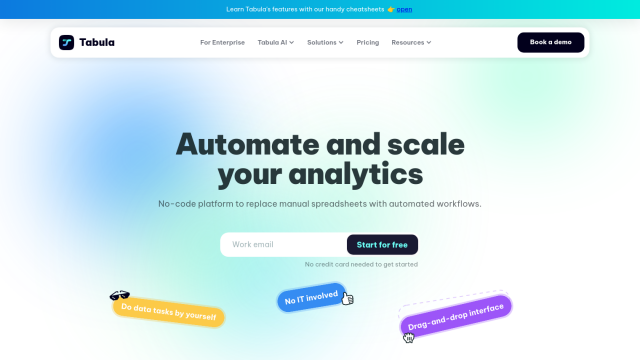
Tabula screenshot thumbnail

Tabula

Automate data workflows, standardize disparate sources, and gain real-time insights without coding, empowering data-driven decision-making across departments.

Dataloop screenshot thumbnail

Dataloop

Unify data, models, and workflows in one environment, automating pipelines and incorporating human feedback to accelerate AI application development and improve quality.

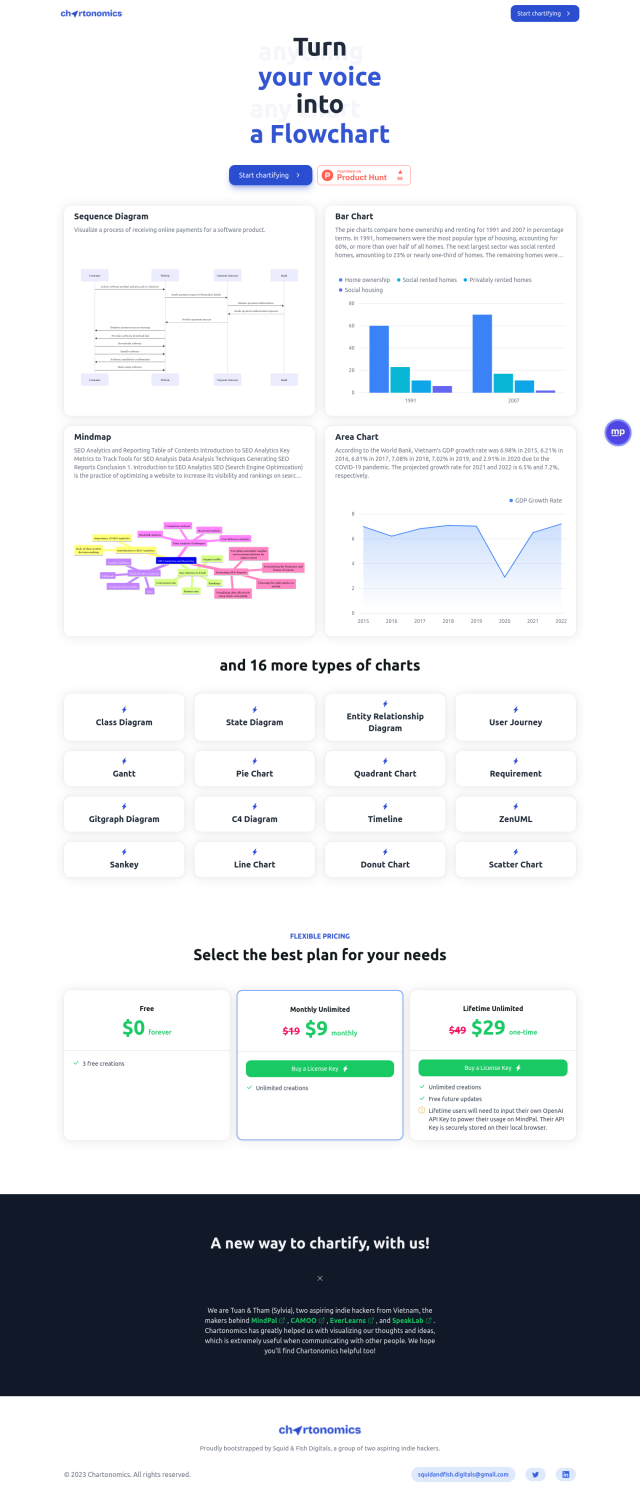
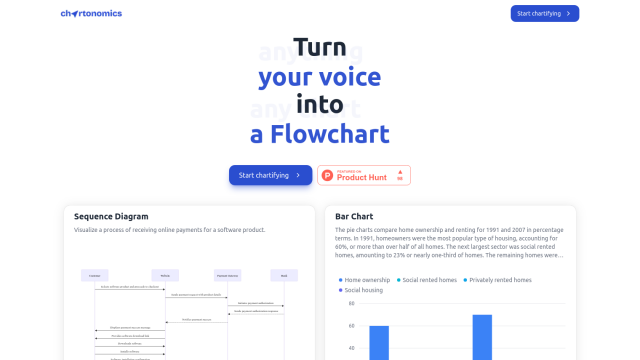
Chartonomics screenshot thumbnail

Chartonomics

Convert any data into 20+ chart types with a single click, no setup required, for instant visualization and communication of complex ideas.

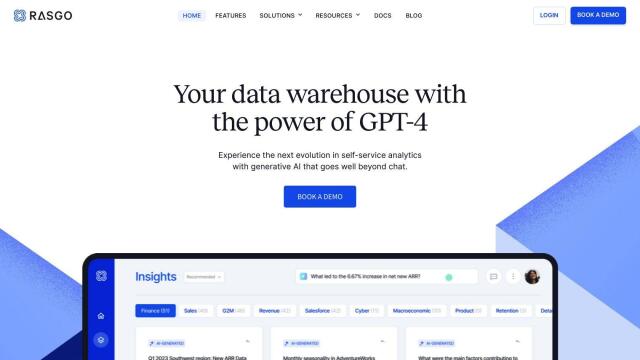
Rasgo screenshot thumbnail

Rasgo

Ask plain language questions and get instant, automated insights with 24/7 intelligent analysis, secured and customized with business context and visualizations.

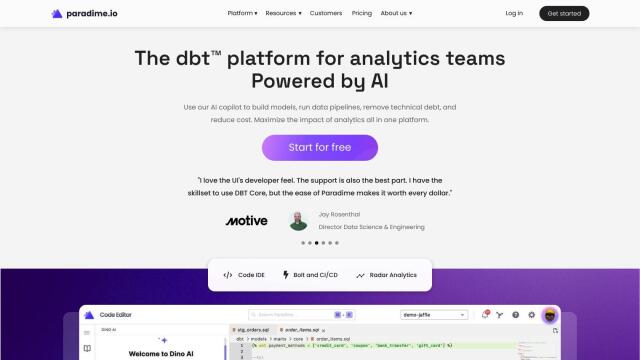
Paradime screenshot thumbnail

Paradime

Streamline analytics workflows with a comprehensive platform offering code editing, no-code job scheduling, data quality monitoring, and real-time insights.

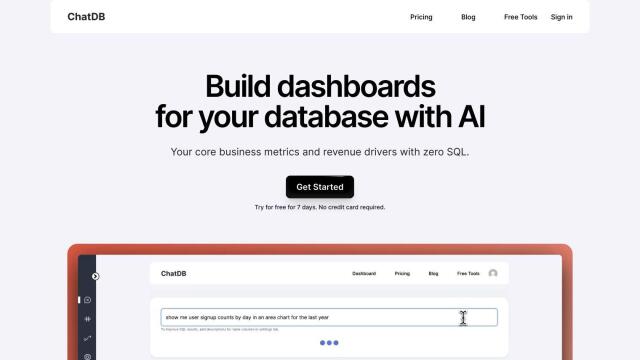
ChatDB screenshot thumbnail

ChatDB

Query your database using natural language, with AI generating the necessary SQL, and create engaging charts for quick business insights.

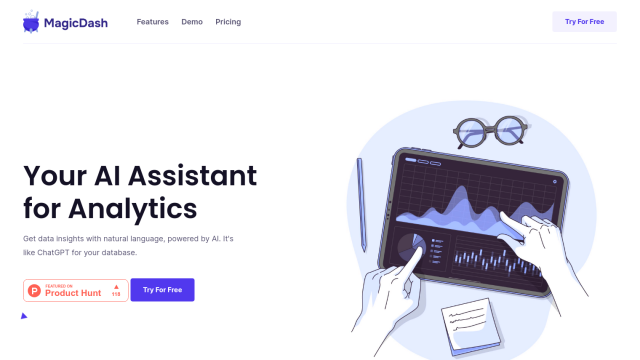
Magic Dash screenshot thumbnail

Magic Dash

Ask natural language questions to access database insights in seconds, without coding, with a single-click connection to multiple databases.

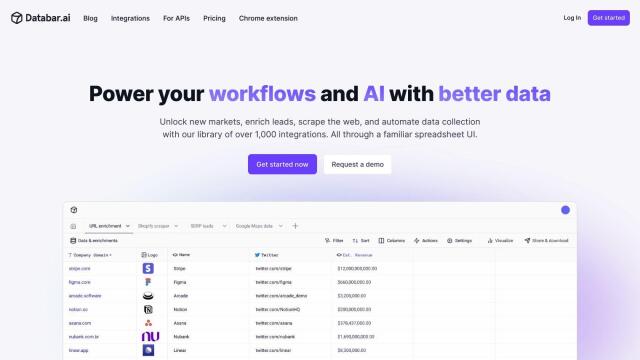
Databar screenshot thumbnail

Databar

Connect to 1,000+ APIs without coding, automate workflows, and enrich data in real-time to power business operations across various industries.

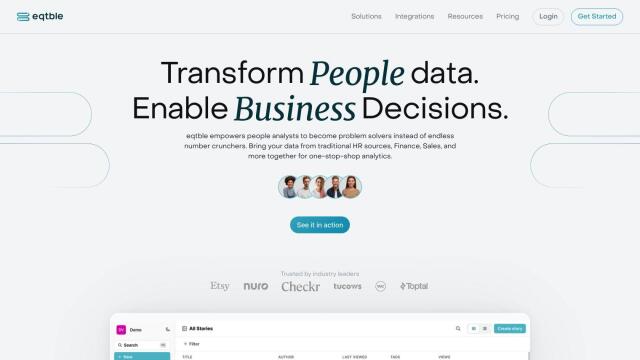
eqtble screenshot thumbnail

eqtble

Centralizes people data from various sources, enabling analysts to create data-driven stories and collaborate with others to drive informed decision-making.

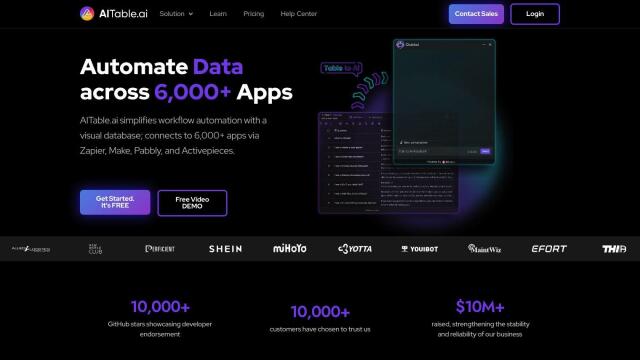
AITable screenshot thumbnail

AITable

Streamline workflow automation with a visual database, connecting to over 6,000 apps, and automate repetitive tasks with customizable forms and AI-driven content generation.

Airtable screenshot thumbnail

Airtable

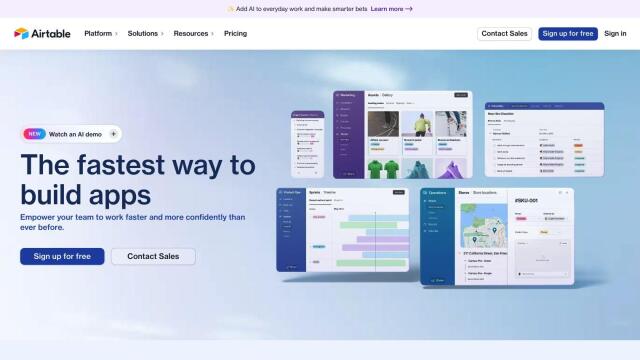
Operationalize data and redesign workflows with AI-driven automation, custom interfaces, and real-time data visualization, all without extensive coding.

Deep Talk screenshot thumbnail

Deep Talk

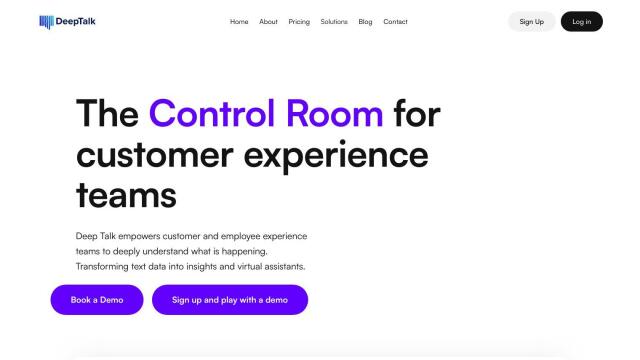
Analyze customer and employee feedback from multiple sources, uncovering sentiment, trends, and patterns to drive business improvements and enhanced satisfaction.

Slatebox screenshot thumbnail

Slatebox

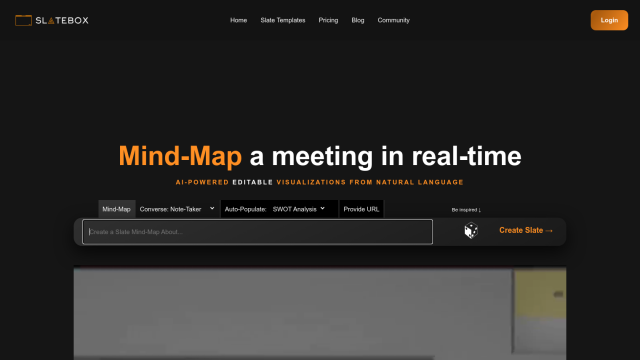
Create editable visualizations from natural language prompts in real-time, fostering efficient team collaboration and diagram creation.

Noodl screenshot thumbnail

Noodl

Build full-stack applications quickly with a visual development tool that integrates AI-generated building blocks, database queries, and UI elements for rapid iteration.

Storytell screenshot thumbnail

Storytell

Combines multiple large language models to automate repetitive tasks, organize data, and produce actionable insights, streamlining workflows for increased productivity.