Question: Is there a tool that can help me turn written data into compelling graphics and charts with minimal design effort?

Canva screenshot thumbnail

Canva

If you want to turn written information into engaging graphics and charts with as little design work as possible, Canva is a popular choice. The free online graphic design tool has a wealth of templates and design elements to create professional-looking designs. It's got AI tools to generate words and edit photos, and it's got real-time collaboration abilities. Canva also integrates with other tools and offers a range of pricing tiers for individuals and large businesses.

Visme screenshot thumbnail

Visme

Another top pick is Visme, an interactive content platform that includes AI-powered design tools and customizable templates. It's good for creating presentations, infographics and other design materials that look professional. Visme also has a branded content tool, content calendar and real-time collaboration abilities, so it's good for marketing, sales and education teams.

Piktochart screenshot thumbnail

Piktochart

If you want something more direct, Piktochart offers an AI-boosted infographic creator with a drag-and-drop interface. It's got professional templates and data visualization tools, making it good for marketers, salespeople and teachers. Piktochart also has an AI video editor and plenty of customization options so you can make content that's engaging without a lot of work.
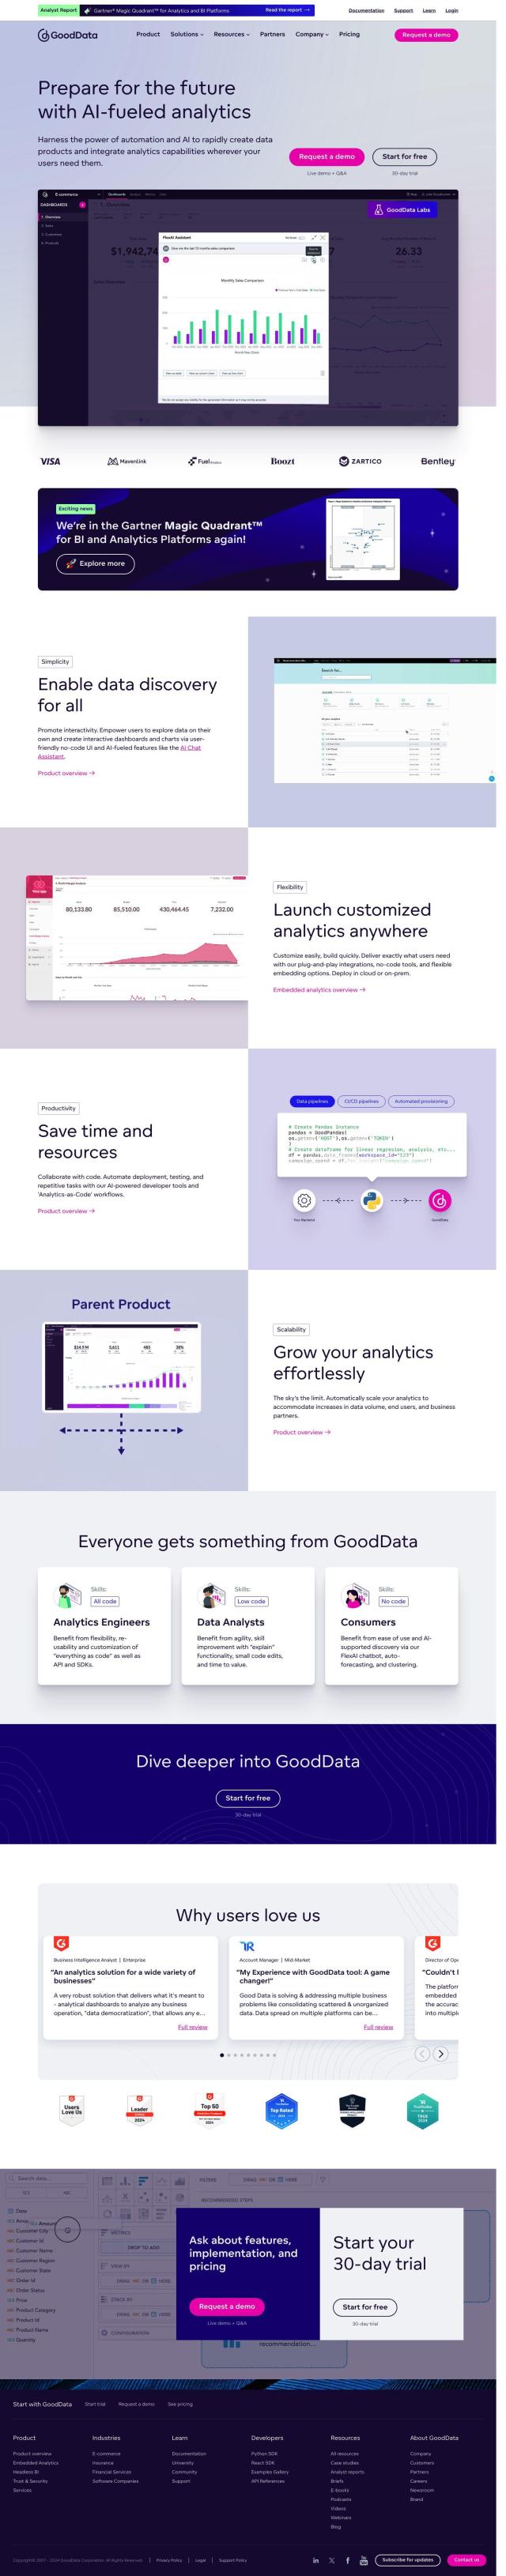
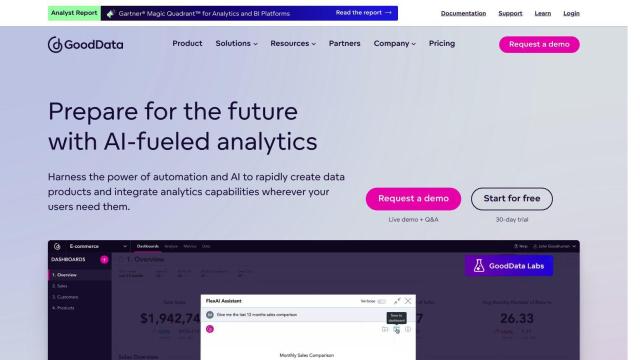
Onvo screenshot thumbnail

Onvo

Last, Onvo is an AI-powered data visualization tool that makes it easier to create interactive charts and insights. You can connect to different data sources, create dashboards with simple AI prompts, and customize styling to match your brand. It's good for startups and enterprises that want to free up time and automate some workflow while creating engaging dashboards.

Additional AI Projects

Chartonomics screenshot thumbnail

Chartonomics

Convert any data into 20+ chart types with a single click, no setup required, for instant visualization and communication of complex ideas.

ChartAI screenshot thumbnail

ChartAI

Generate various charts and diagrams, including pie charts, flowcharts, and mind maps, from entire data sets with a user-friendly, ChatGPT-like interface.

Infografix screenshot thumbnail

Infografix

Instantly create infographics with text prompts, choosing from various templates and customization options, and export or share directly.

Venngage screenshot thumbnail

Venngage

Create engaging visual content with 10,000+ templates and an AI-infographic generator that turns written prompts and raw data into compelling graphics.

Image Charts screenshot thumbnail

Image Charts

Automatically create custom charts from data, including line, pie, and scatter charts, with branding and embedding options for seamless integration.

DataChat screenshot thumbnail

DataChat

Access complex data insights without coding, using a familiar chat and spreadsheet interface to generate transparent, reproducible results.

Graphy screenshot thumbnail

Graphy

Combine data from multiple sources into interactive, shareable reports in minutes, with AI-powered tools reducing creation time by 80%.

Polymer screenshot thumbnail

Polymer

Converts complex data into intuitive, actionable visualizations, linking multiple sources and generating real-time insights with AI-driven analytics and suggested trends.

Dreamwriter screenshot thumbnail

Dreamwriter

Generates high-quality, on-brand content in minutes, tailored to specific audiences and personas, with customizable designs and real-time collaboration features.

Tabula screenshot thumbnail

Tabula

Automate data workflows, standardize disparate sources, and gain real-time insights without coding, empowering data-driven decision-making across departments.

Jeda.ai screenshot thumbnail

Jeda.ai

Collaborative, interactive canvas for creating, visualizing, and analyzing data, turning ideas into beautiful visuals and insights with advanced generative AI capabilities.

Grapha.ai screenshot thumbnail

Grapha.ai

Explore complex data with AI-driven trend and pattern detection, and turn data into actionable insights with a simple, accessible interface.

GoodData screenshot thumbnail

GoodData

Quickly build custom data products with interactive analytics abilities, leveraging AI-powered features like a no-code interface and chat assistant for effortless insights.

Canvas screenshot thumbnail

Canvas

Link, query, and visualize data from 150+ SaaS tools without coding, empowering non-technical teams to make data-informed decisions.

Tome screenshot thumbnail

Tome

Automates sales research and deck customization, analyzing internal and external data to create personalized presentations faster, boosting business intelligence and sales productivity.

Wepik screenshot thumbnail

Wepik

Create professional-looking visual materials quickly and easily with AI-powered tools, customizable templates, and a user-friendly drag-and-drop interface.

Freepik screenshot thumbnail

Freepik

Generate high-quality images, videos, and templates in real-time with AI-powered tools, boosting productivity and creative freedom for designers and content creators.

EdrawMax screenshot thumbnail

EdrawMax

Create engaging diagrams in seconds with AI-powered tools, leveraging a vast template library and collaborative workspace for seamless visual collaboration.

Vizzly screenshot thumbnail

Vizzly

Build and share interactive, customizable analytics experiences with a no-code dashboard builder, empowering users to explore data without technical hassle.

data.to.design screenshot thumbnail

data.to.design

Fill designs with real content for more realistic prototypes, stress test under different conditions, and add logic to components with seamless Figma integration.