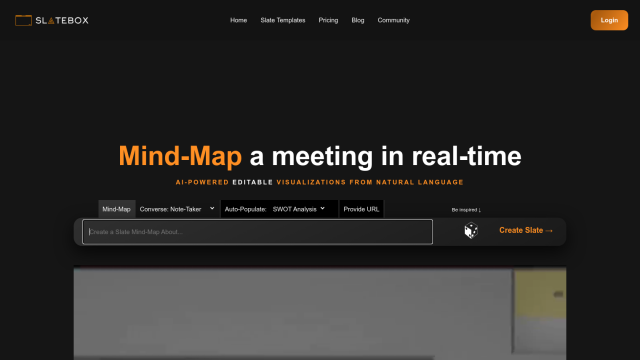
Question: Need a platform that allows me to create complex graphs and visualizations quickly, any options?
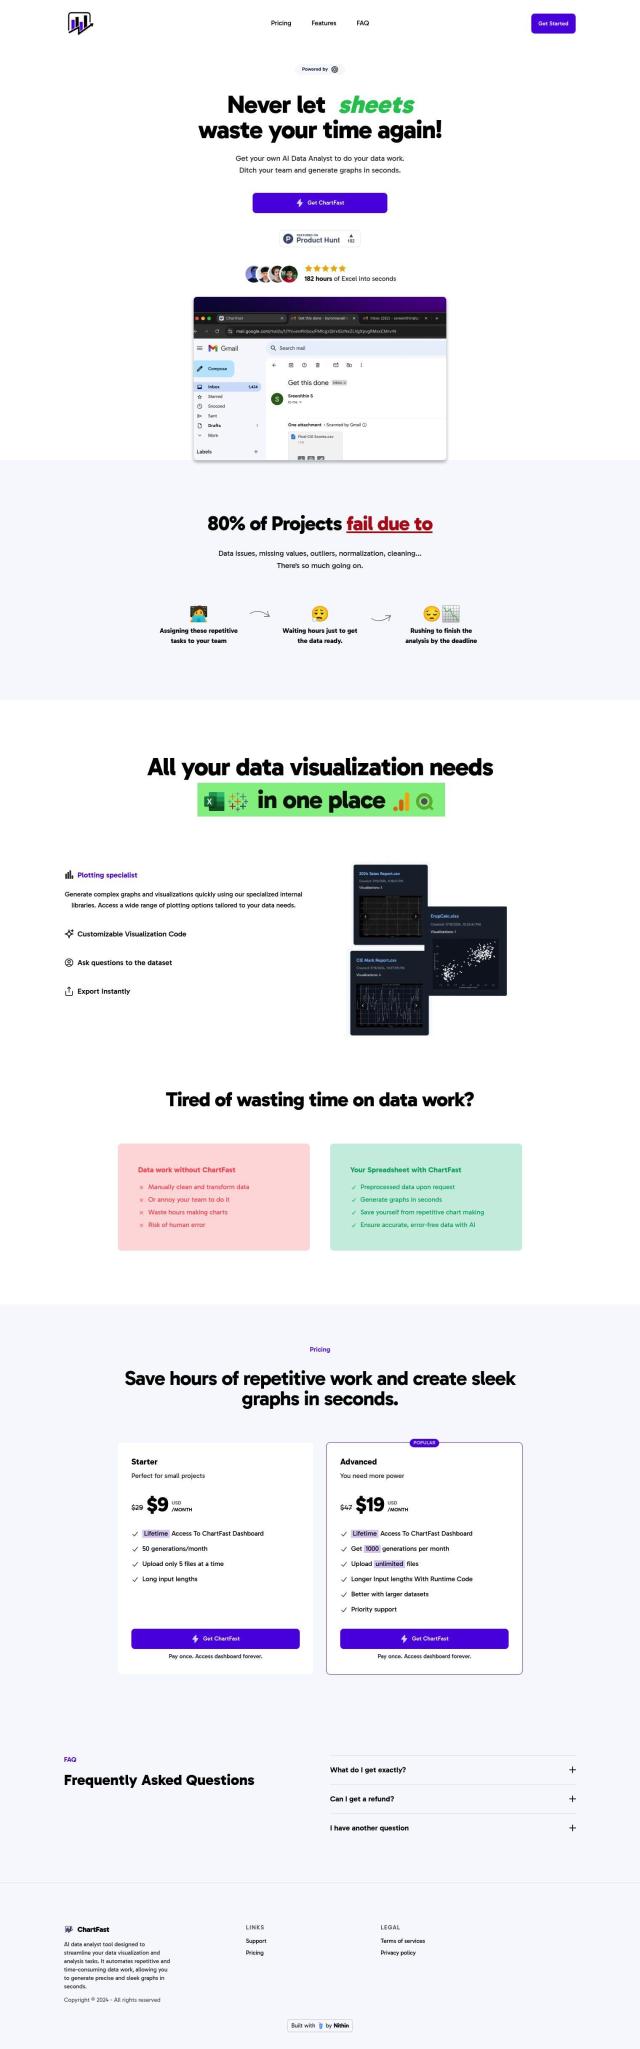
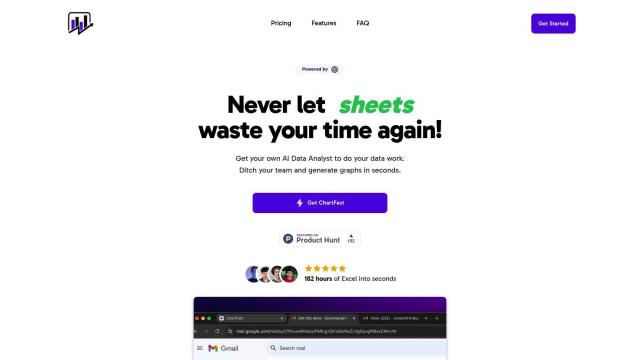
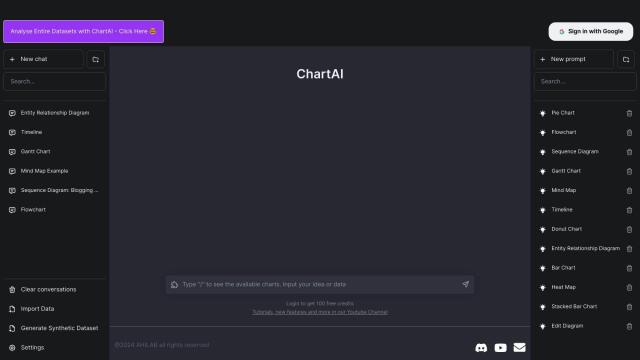
ChartFast screenshot thumbnail

ChartFast

If you need a platform to build complex graphs and visualizations as fast as possible, ChartFast is worth a look. This AI-powered data analyst tool automates data visualization and analysis tasks, including common data problems like handling missing values, outliers, normalization and cleaning. It lets you build complex graphs and visualizations as fast as possible, run custom visualization code and export data immediately in .csv or Excel format. ChartFast is good for people who have to wrestle with big data sets and need to get things done fast and right.
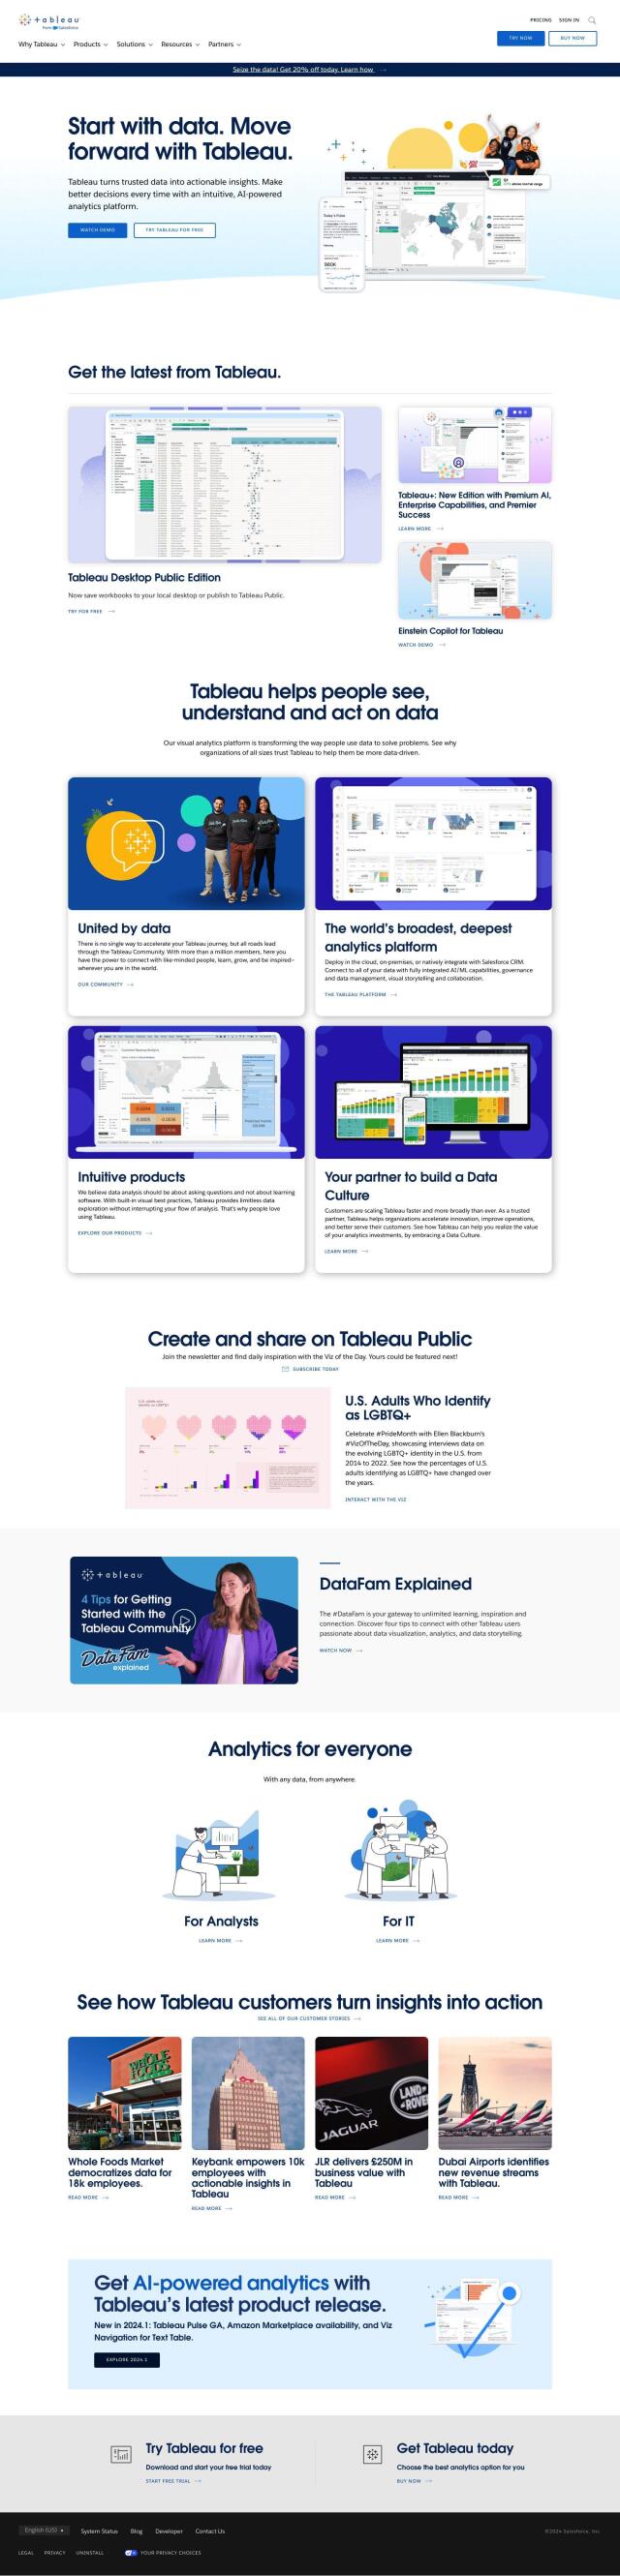
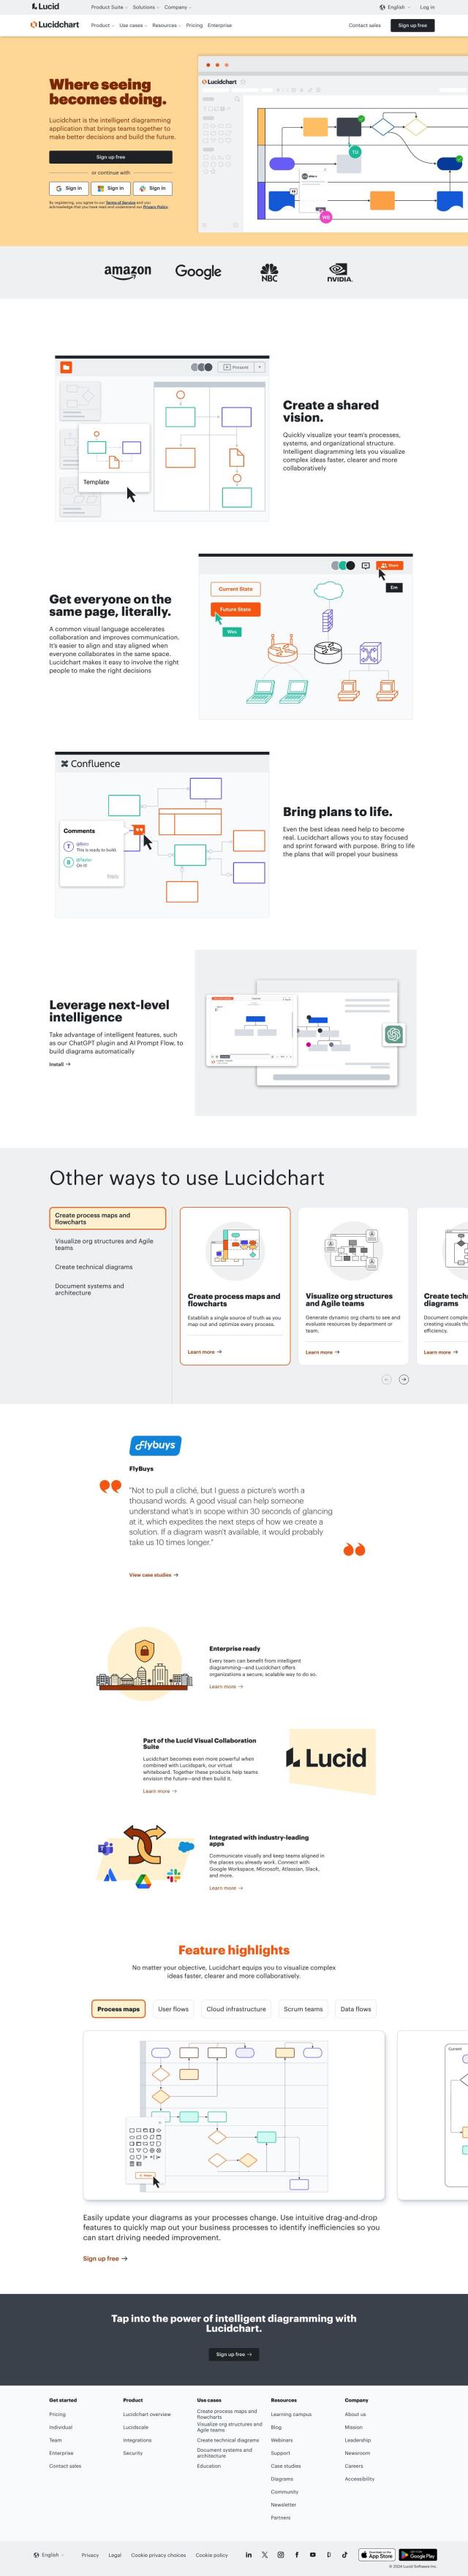
Tableau screenshot thumbnail

Tableau

Another good option is Tableau, a business intelligence and analytics tool. Tableau can connect to a variety of databases and lets you build visualizations through drag-and-drop interfaces. It also has features like cloud, on-premises and Salesforce CRM deployment options, AI/ML capabilities, governance and data management, visual storytelling and collaboration tools. With several editions and pricing tiers, including a free trial, Tableau is a good option for building and sharing visualizations.
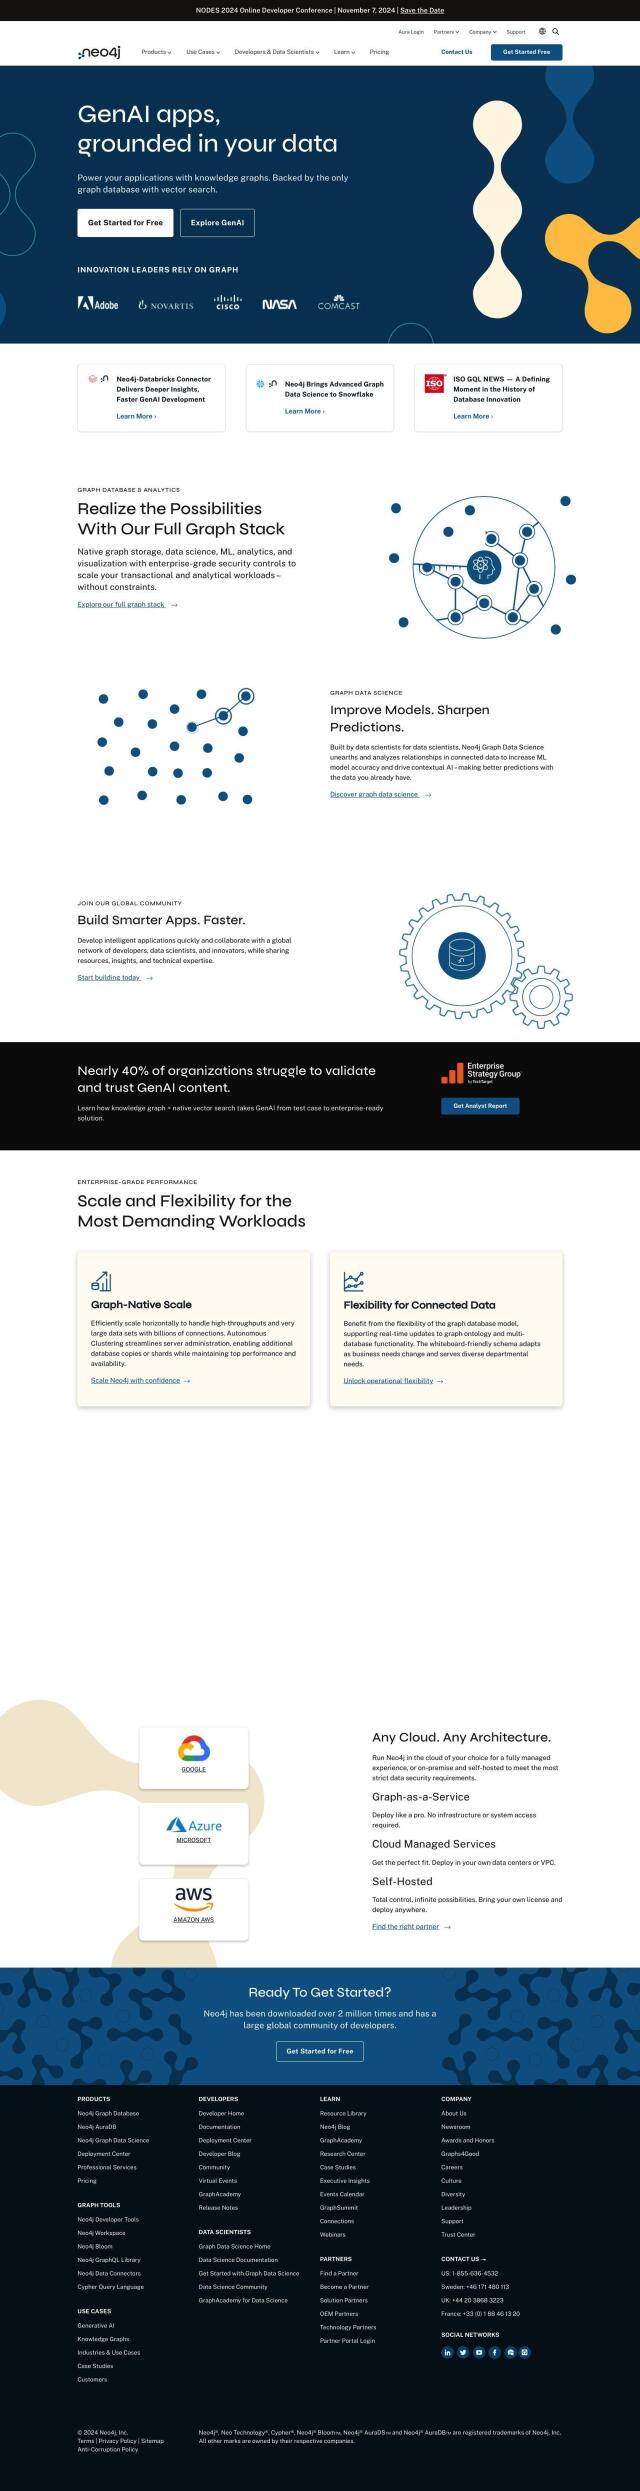
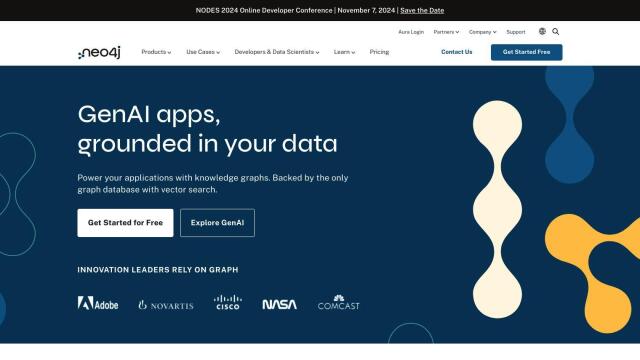
Neo4j screenshot thumbnail

Neo4j

If you're looking for a graph data platform, Neo4j is a good option. Neo4j is geared for connecting and analyzing complex data, with features like data science and machine learning support, vector search and analytics. It's good for developers, data scientists and companies trying to extract insights from complex data structures, with graph-native scale, flexibility and enterprise-grade security. Neo4j offers several deployment options, including self-hosted, cloud-managed and fully managed services, making it a high-performance graph database option.

Onvo screenshot thumbnail

Onvo

Last, Onvo is another AI-powered data visualization tool that lets you create interactive charts and insights with relative ease. You can connect to different data sources, build dashboards with simple AI prompts, customize styling and share or embed dashboards into your own products. Onvo promises time savings, streamlined workflows, automation, natural interaction and personalized analysis, which makes it a good option for startups and enterprises.

Additional AI Projects

ChartAI screenshot thumbnail

ChartAI

Generate various charts and diagrams, including pie charts, flowcharts, and mind maps, from entire data sets with a user-friendly, ChatGPT-like interface.

Lucidchart screenshot thumbnail

Lucidchart

Create intuitive, interactive diagrams with AI-powered tools and real-time collaboration features.

Grafbase screenshot thumbnail

Grafbase

Unify data sources into a single graph, deploy anywhere, and enjoy advanced security, caching, and analytics for seamless GraphQL API development.

Jeda.ai screenshot thumbnail

Jeda.ai

Collaborative, interactive canvas for creating, visualizing, and analyzing data, turning ideas into beautiful visuals and insights with advanced generative AI capabilities.

Spotfire screenshot thumbnail

Spotfire

Combines self-service data visualization and advanced data science in a single workflow, empowering users to connect, analyze, and act on data for better business outcomes.

Polymer screenshot thumbnail

Polymer

Converts complex data into intuitive, actionable visualizations, linking multiple sources and generating real-time insights with AI-driven analytics and suggested trends.

GoodData screenshot thumbnail

GoodData

Quickly build custom data products with interactive analytics abilities, leveraging AI-powered features like a no-code interface and chat assistant for effortless insights.

Graphy screenshot thumbnail

Graphy

Combine data from multiple sources into interactive, shareable reports in minutes, with AI-powered tools reducing creation time by 80%.

Chartonomics screenshot thumbnail

Chartonomics

Convert any data into 20+ chart types with a single click, no setup required, for instant visualization and communication of complex ideas.

Grapha.ai screenshot thumbnail

Grapha.ai

Explore complex data with AI-driven trend and pattern detection, and turn data into actionable insights with a simple, accessible interface.

Dash screenshot thumbnail

Dash

Build interactive, data-driven applications with Python, deploying and sharing with a single click, and scaling on any cloud infrastructure.

Franz screenshot thumbnail

Franz

Scalable, high-performance graph database platform integrating large language models and vector storage to transform complex data into business insights.

Hex screenshot thumbnail

Hex

Unify data teams with AI-assisted exploration, collaboration, and interactive reporting, accelerating data work and improving accuracy in a single, modular workspace.

Mode screenshot thumbnail

Mode

Unify data analysis and visualization with SQL, R, Python, and interactive dashboards to accelerate insights and collaboration across teams.

Tabula screenshot thumbnail

Tabula

Automate data workflows, standardize disparate sources, and gain real-time insights without coding, empowering data-driven decision-making across departments.

Coupler.io screenshot thumbnail

Coupler.io

Easily gather, visualize, and automate data from 200+ integrations with a drag-and-drop interface, empowering data-driven decisions without requiring coding expertise.

CARTO screenshot thumbnail

CARTO

Analyze and visualize spatial data at any scale with native cloud integration, intuitive drag-and-drop interface, and built-in GenAI capabilities.

Slatebox screenshot thumbnail

Slatebox

Create editable visualizations from natural language prompts in real-time, fostering efficient team collaboration and diagram creation.

Embeddable screenshot thumbnail

Embeddable

Craft compelling customer-facing analytics experiences and embed them directly into your application, with full control and flexibility, in a fraction of the time.

Graphlit screenshot thumbnail

Graphlit

Extracts insights from unstructured data like documents, audio, and images using Large Multimodal Models, automating content workflows and enriching data with third-party APIs.