Question: I'm looking for a solution that can help me convert complex data into easy-to-understand charts and graphs.

Polymer screenshot thumbnail

Polymer

If you're looking for a way to turn complex data into charts and graphs that are easy to understand, Polymer could be just the ticket. It's an AI-powered dashboard creation tool that can turn complex data into insights automatically. With more than 20 data connectors and real-time insights through automated dashboard updates, it's easy to make data-informed decisions. Highlights include AI-driven insights, personalized visualization through PolyAI chat, and pre-built templates for different use cases.
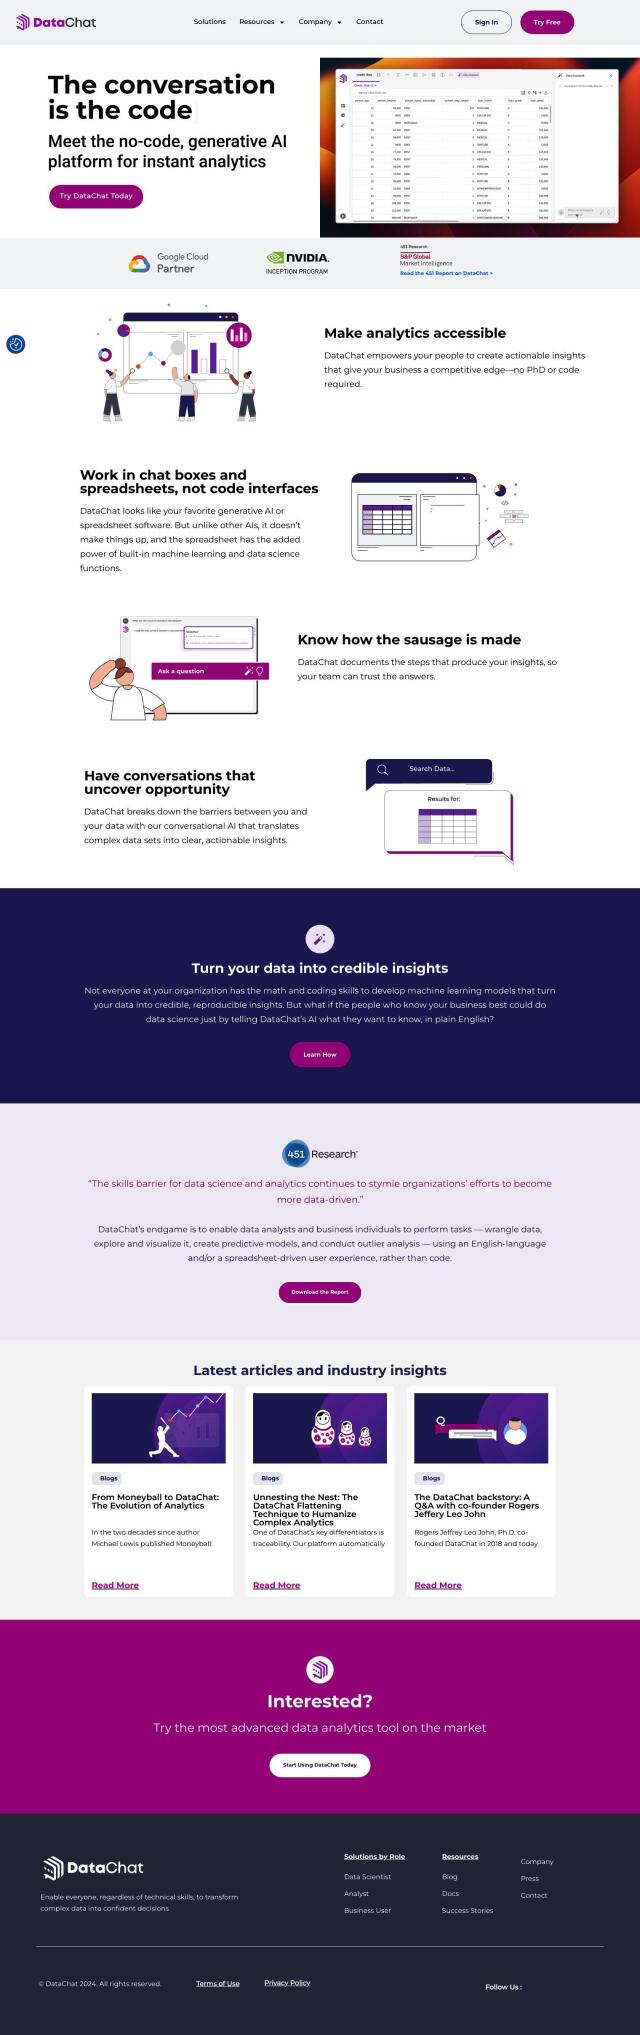
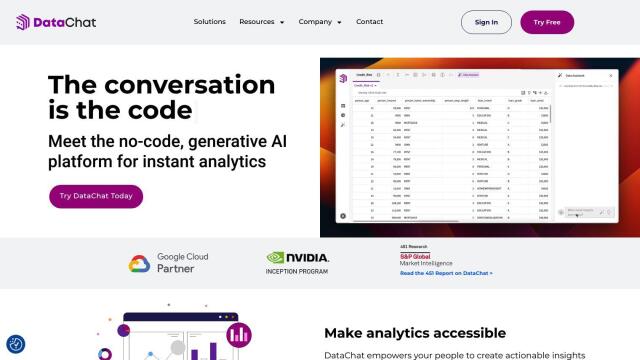
DataChat screenshot thumbnail

DataChat

Another top contender is DataChat, a no-code generative AI tool that can turn complex data into insights without requiring programming skills. It's got an interface that's somewhere between spreadsheets and chat software, so it's accessible to people with varying levels of technical expertise. DataChat automates data preparation, exploration and modeling, and lets you ask questions and get AI-generated answers. That makes it good for data scientists, analysts and business users.

Onvo screenshot thumbnail

Onvo

If you want interactive, customizable visualizations, Onvo is an AI-powered data visualization tool. You can create interactive charts and dashboards with simple AI prompts, connect to different data sources and customize the look to match your brand. It's good for startups and enterprises that want to automate workflows and make data analysis more efficient.
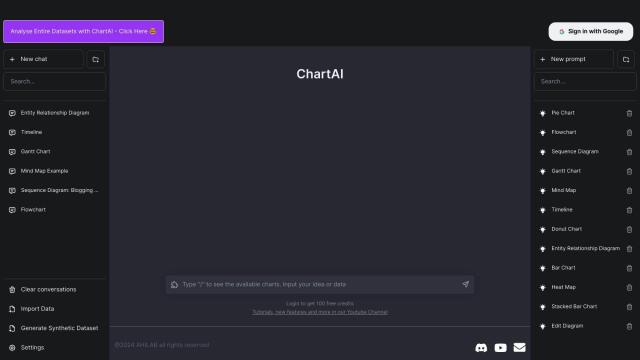
ChartAI screenshot thumbnail

ChartAI

Last, ChartAI is an information visualization system that can handle entire data sets with a range of visualization options. That includes everything from pie charts to mind maps and heat maps, so it's good for a wide range of situations. ChartAI is designed for people with limited technical expertise, with an interface for data visualization and analysis that's easy to use.

Additional AI Projects

TalktoData screenshot thumbnail

TalktoData

Ask questions in plain English and get immediate answers and visualizations from connected data sources, without needing to write code or wrangle data.

GoodData screenshot thumbnail

GoodData

Quickly build custom data products with interactive analytics abilities, leveraging AI-powered features like a no-code interface and chat assistant for effortless insights.

DataGPT screenshot thumbnail

DataGPT

Get instant, analyst-level answers to data questions in seconds, with automated insights and visualizations, making complex data analysis accessible to everyone.

Chartonomics screenshot thumbnail

Chartonomics

Convert any data into 20+ chart types with a single click, no setup required, for instant visualization and communication of complex ideas.

Domo screenshot thumbnail

Domo

Unifies data from any source, providing AI-driven insights and automation to drive real-time decisions and meaningful actions across the organization.

Graphy screenshot thumbnail

Graphy

Combine data from multiple sources into interactive, shareable reports in minutes, with AI-powered tools reducing creation time by 80%.

datapine (RIB BI+) screenshot thumbnail

datapine (RIB BI+)

Empower data-driven decision-making with self-service analytics, combining data from multiple sources into a single, secure point of truth.

Tabula screenshot thumbnail

Tabula

Automate data workflows, standardize disparate sources, and gain real-time insights without coding, empowering data-driven decision-making across departments.

Zing Data screenshot thumbnail

Zing Data

Get answers to data questions in seconds, without expertise, using intuitive natural language querying and automated data modeling.

Canvas screenshot thumbnail

Canvas

Link, query, and visualize data from 150+ SaaS tools without coding, empowering non-technical teams to make data-informed decisions.

Grapha.ai screenshot thumbnail

Grapha.ai

Explore complex data with AI-driven trend and pattern detection, and turn data into actionable insights with a simple, accessible interface.

Tractorscope screenshot thumbnail

Tractorscope

Turn complex data into meaningful insights with customizable dashboards and charts.

Patterns screenshot thumbnail

Patterns

Ask a question, get an answer in seconds, without manual data analysis, using AI-powered SQL, charts, and explanations.

Hex screenshot thumbnail

Hex

Unify data teams with AI-assisted exploration, collaboration, and interactive reporting, accelerating data work and improving accuracy in a single, modular workspace.

Jeda.ai screenshot thumbnail

Jeda.ai

Collaborative, interactive canvas for creating, visualizing, and analyzing data, turning ideas into beautiful visuals and insights with advanced generative AI capabilities.

Lychee screenshot thumbnail

Lychee

Analyze multiple data sets at once, connecting directly to various sources, without coding, and visualize insights with informative charts and polished presentations.

Athena screenshot thumbnail

Athena

Accelerate analytics workflows with an AI-native platform that learns your workflow, automates tasks, and enables collaborative data analysis with natural language interaction.

Alteryx screenshot thumbnail

Alteryx

Automates workflows, delivers self-service insights, and aligns data analysis with strategic business outcomes, empowering enterprise analytics for all users and roles.

Decipad screenshot thumbnail

Decipad

Combine data, formulas, and text into interactive notebooks, bridging the gap between analysis and storytelling with easy-to-understand models and real-time data updates.

Spreadsheet.com screenshot thumbnail

Spreadsheet.com

Combines spreadsheet interface with automation, customizable views, and integrations to streamline project management, data tracking, and team collaboration.