Question: How can I create reusable charting components and leverage my existing design system to build custom analytics dashboards?
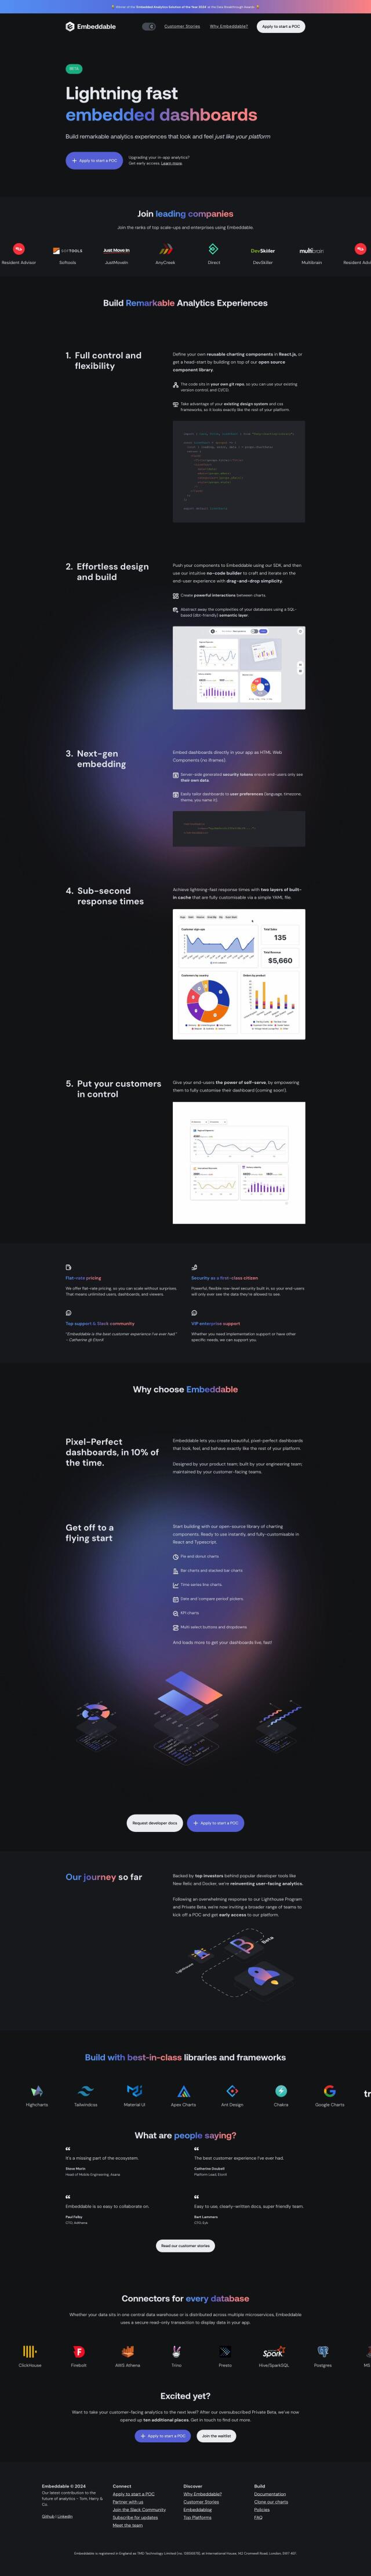
Embeddable screenshot thumbnail

Embeddable

Embeddable is a flexible foundation for building and embedding interactive customer-facing analytics experiences. It provides custom, reusable React.js components that fit with your existing design system and CSS frameworks. With features like easy design and build, customizable caching, and support for libraries like ChartJS, D3 and Highcharts, Embeddable is great for product and engineering teams that want to deliver pixel-perfect, customizable dashboards as fast as possible.
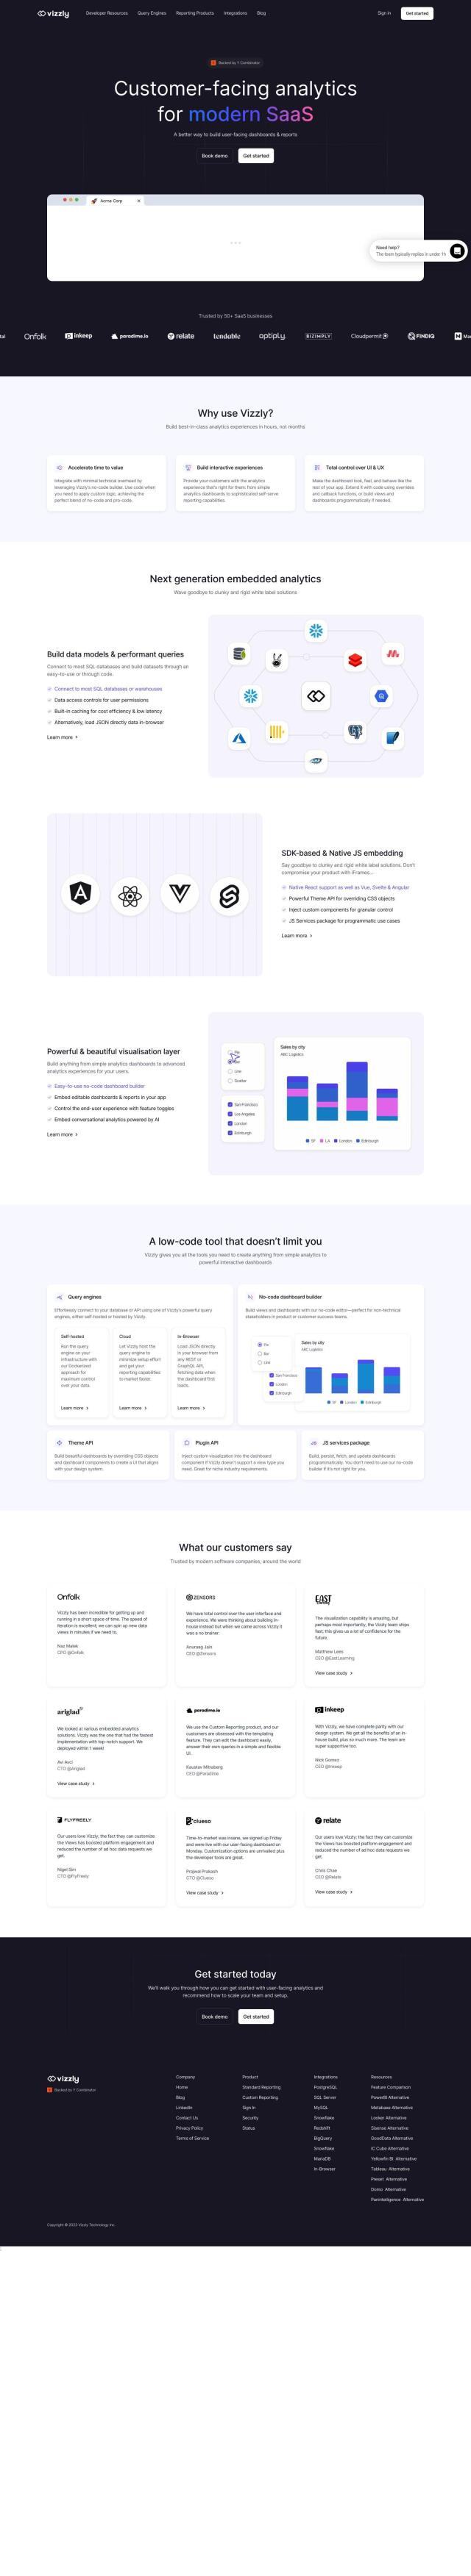
Vizzly screenshot thumbnail

Vizzly

Another good option is Vizzly, which is geared for modern SaaS companies that want to build, share and embed data-driven experiences. Vizzly's no-code builder lets you create interactive analytics dashboards with a low technical burden, and its Theme API lets you customize the UI and UX to fit your existing design system. Vizzly also offers self-serve reporting, connections to most SQL databases, and a choice of self-hosted, cloud-hosted or in-browser query engines, so you can easily add analytics abilities and improve the user experience.
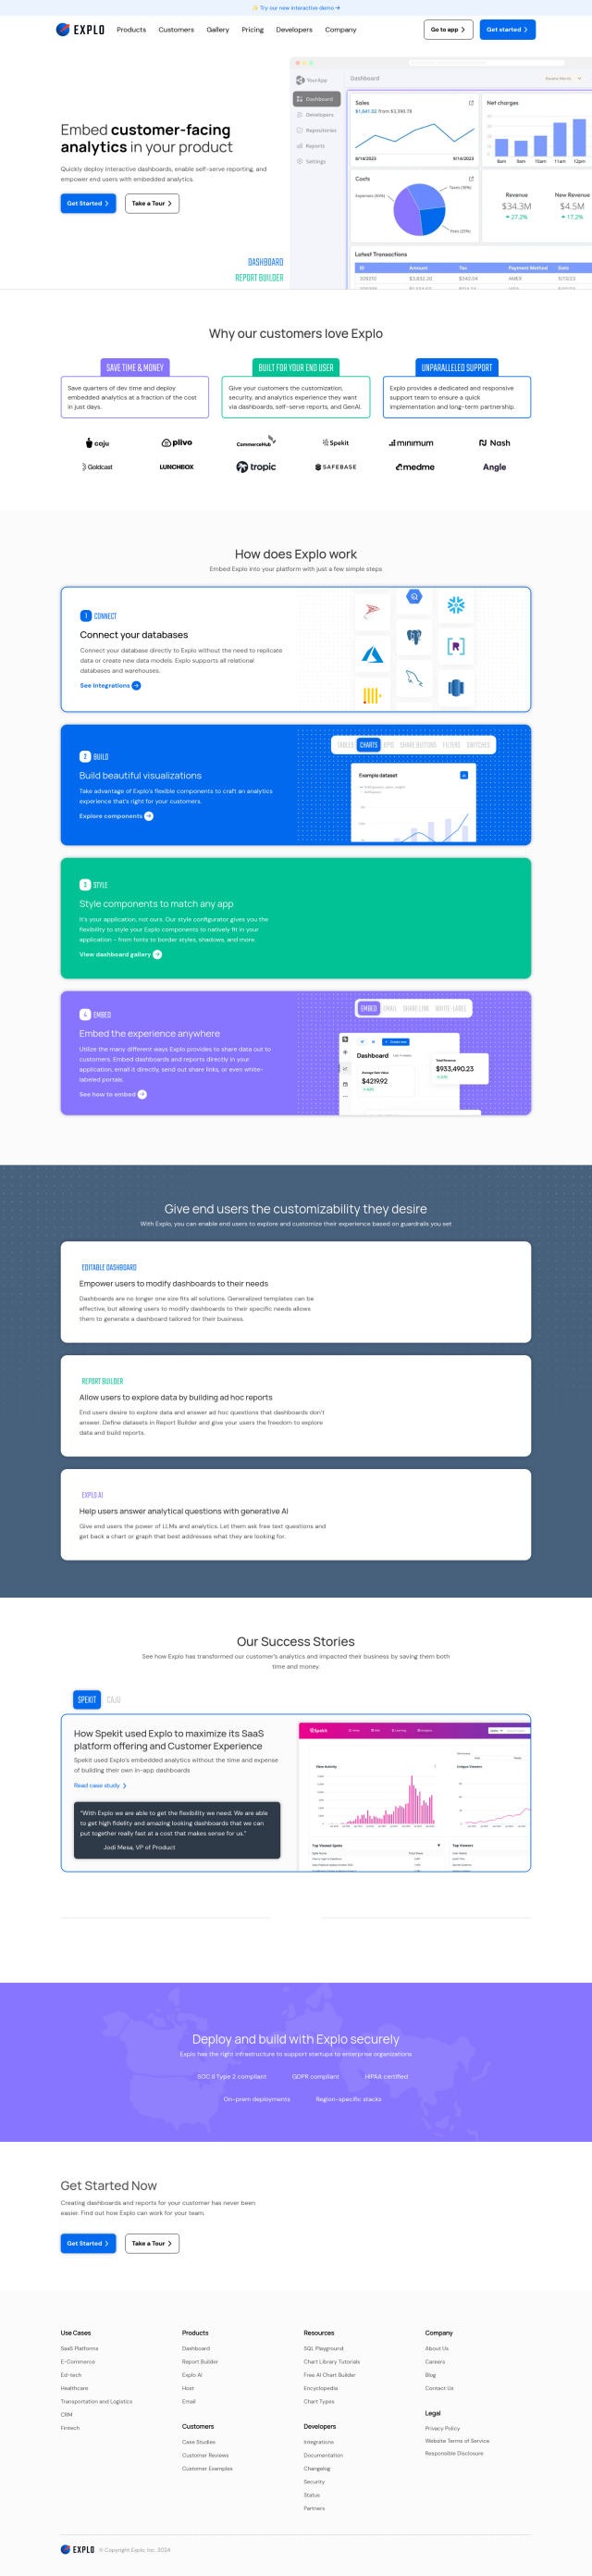
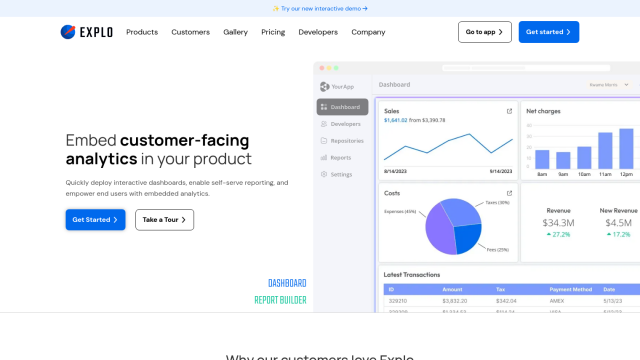
Explo screenshot thumbnail

Explo

For a more complete solution, Explo offers features like customizable analytics experiences built from interchangeable components, connections to multiple relational databases and data warehouses, and enterprise-grade security. Explo spans a broad set of use cases and has a variety of pricing tiers, so it's a good option for teams that want to embed interactive dashboards and self-serve reporting directly into their apps.

Additional AI Projects

GoodData screenshot thumbnail

GoodData

Quickly build custom data products with interactive analytics abilities, leveraging AI-powered features like a no-code interface and chat assistant for effortless insights.

Tableau screenshot thumbnail

Tableau

Connect to any data source, create visualizations, and share insights with an intuitive, AI-infused analytics platform that drives better decision-making.

Sisense screenshot thumbnail

Sisense

Embed AI-infused analytics into products and applications with customizable look and feel, connecting data from multiple sources for personalized insights.

Onvo screenshot thumbnail

Onvo

Create interactive charts and insights with simple AI prompts, eliminating the need for complex queries and customizations.

Polymer screenshot thumbnail

Polymer

Converts complex data into intuitive, actionable visualizations, linking multiple sources and generating real-time insights with AI-driven analytics and suggested trends.

Qlik screenshot thumbnail

Qlik

Unifies data from hundreds of sources into a single fabric, enabling customers to integrate, transform, analyze, and take action on their data for better decisions.

Luzmo screenshot thumbnail

Luzmo

Add interactive, AI-powered dashboards to SaaS products in weeks, providing real-time insights and self-service analytics for customers.

Streamlit screenshot thumbnail

Streamlit

Build interactive data apps with a few lines of code, and deploy instantly with a single click, without needing front-end programming expertise.

Latitude screenshot thumbnail

Latitude

Automatically generate API endpoints from SQL queries, deploy scalable analytics, and embed interactive visualizations with a lightweight, modular framework.

Quest screenshot thumbnail

Quest

Convert Figma designs into clean, extendable React components with built-in support for popular UI libraries, automating app development and boosting productivity.

Tabula screenshot thumbnail

Tabula

Automate data workflows, standardize disparate sources, and gain real-time insights without coding, empowering data-driven decision-making across departments.

Breadcrumb screenshot thumbnail

Breadcrumb

Transform data into interactive AI dashboards, connecting multiple sources, and track trends in real-time with 100% accurate visualizations and natural language queries.

Hex screenshot thumbnail

Hex

Unify data teams with AI-assisted exploration, collaboration, and interactive reporting, accelerating data work and improving accuracy in a single, modular workspace.

DataChat screenshot thumbnail

DataChat

Access complex data insights without coding, using a familiar chat and spreadsheet interface to generate transparent, reproducible results.

Dash screenshot thumbnail

Dash

Build interactive, data-driven applications with Python, deploying and sharing with a single click, and scaling on any cloud infrastructure.

Airbook screenshot thumbnail

Airbook

Accelerate data analysis and insights generation across teams with native connectors to 150+ data sources, collaborative querying, and visualization tools.

Canvas screenshot thumbnail

Canvas

Link, query, and visualize data from 150+ SaaS tools without coding, empowering non-technical teams to make data-informed decisions.

Graphy screenshot thumbnail

Graphy

Combine data from multiple sources into interactive, shareable reports in minutes, with AI-powered tools reducing creation time by 80%.

Athena screenshot thumbnail

Athena

Accelerate analytics workflows with an AI-native platform that learns your workflow, automates tasks, and enables collaborative data analysis with natural language interaction.

Daydream screenshot thumbnail

Daydream

Unify data, context, and team collaboration to drive informed decisions, with AI-powered connections and expert-built templates for instant business insights.

Stylebit screenshot thumbnail

Stylebit

Analyze design system usage and consistency across company assets with features like component adoption rates, props usage, and variable tracking.