Question: I need a solution that can help me create informative and attractive visualizations from my data without requiring extensive programming knowledge.

DataChat screenshot thumbnail

DataChat

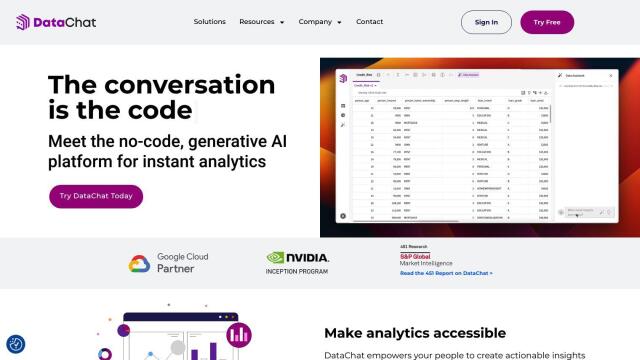
If you're looking for a no-code way to create informative and engaging visualizations from your data, DataChat is a great option. The generative AI platform uses an interface that's similar to what you're already used to with spreadsheet and chat software to make data analysis easier. It automates data prep, exploration and modeling so it's good for data scientists, analysts and business users who need to make decisions fast and with confidence. DataChat offers a 14-day free trial and flexible pricing plans that can grow with your business.

Onvo screenshot thumbnail

Onvo

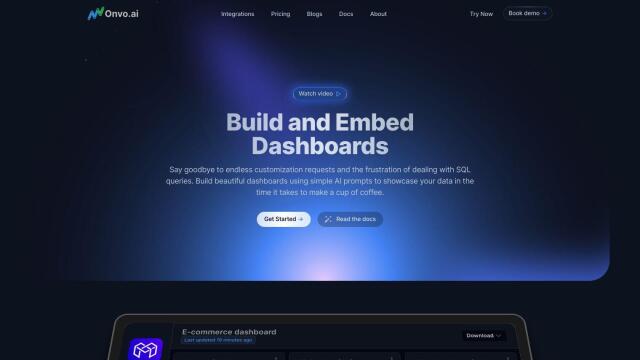
Another option is Onvo, an AI-infused data visualization tool that lets you build interactive charts and dashboards without having to write complicated queries or fiddle with data. It connects to a variety of data sources and offers customization options to match your brand. Onvo's AI technology automates workflows and offers personalized analysis, making it good for startups and enterprises.

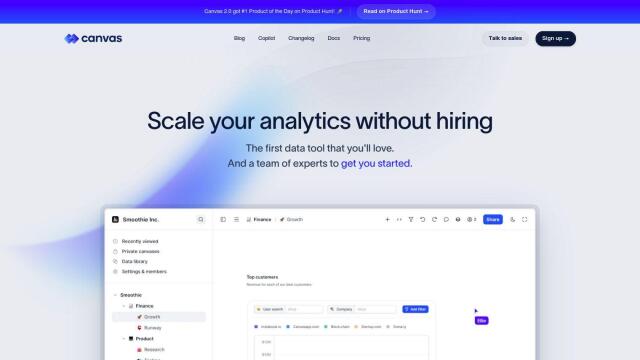
Canvas screenshot thumbnail

Canvas

If you want to connect and visualize data from multiple SaaS tools without writing code, Canvas is worth a look. It comes with pre-built templates for tracking important startup metrics, real-time alerts and live collaboration. Canvas supports multiple users and integrates with tools like dbt, so it's good for both technical and nontechnical team members.


Jeda.ai screenshot thumbnail

Jeda.ai

Last, Jeda.ai offers an interactive generative AI visual workspace where you can create, visualize and analyze data. With tools like visual document insights and AI-powered design tools, Jeda.ai is good for turning data into strategic insights. It's good for a broad range of professional users, and it has strong security and privacy protections.
Additional AI Projects

Lychee screenshot thumbnail

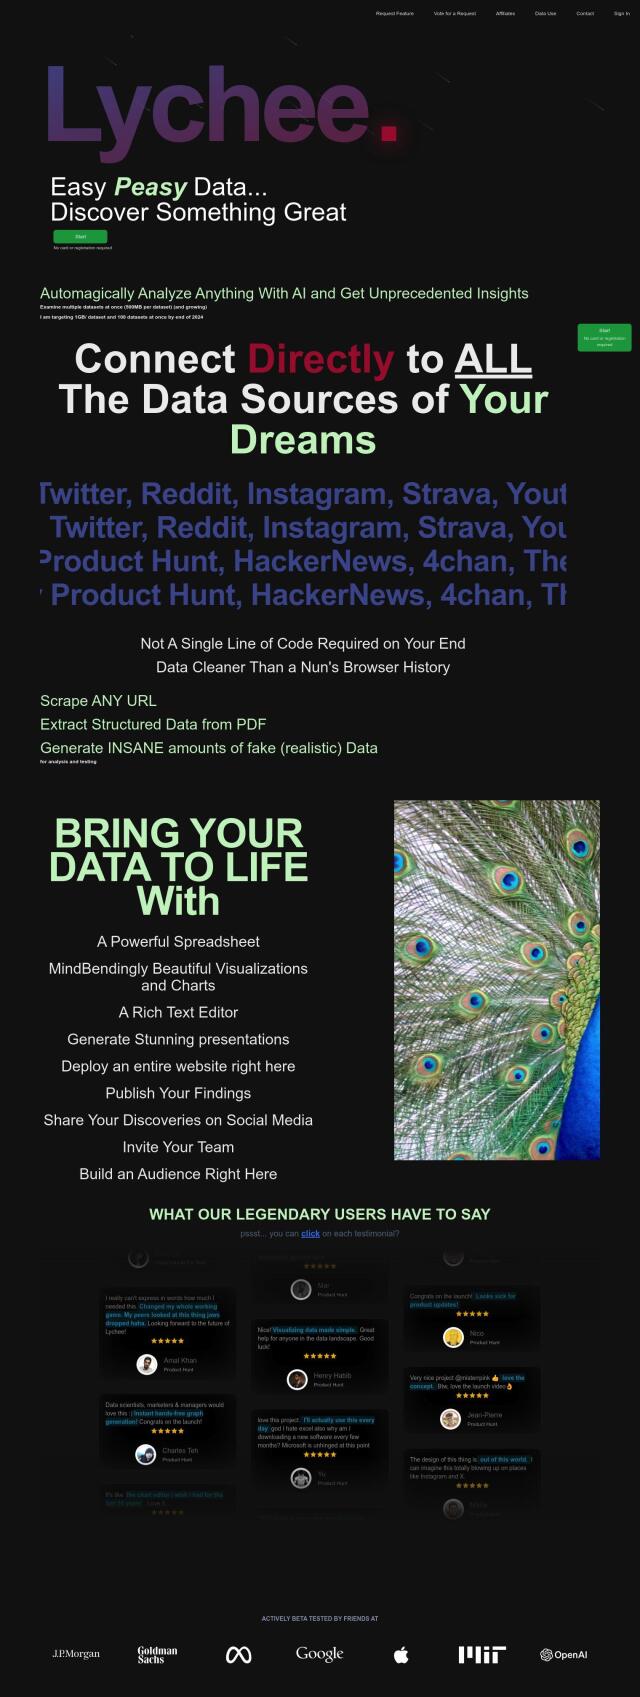
Lychee

Analyze multiple data sets at once, connecting directly to various sources, without coding, and visualize insights with informative charts and polished presentations.

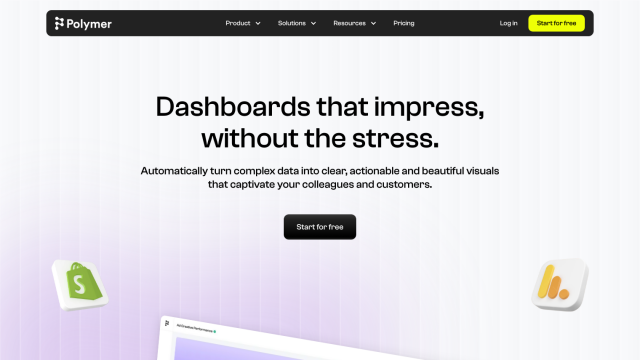
Polymer screenshot thumbnail

Polymer

Converts complex data into intuitive, actionable visualizations, linking multiple sources and generating real-time insights with AI-driven analytics and suggested trends.

Visme screenshot thumbnail

Visme

Create on-brand content fast with AI-assisted design, templates, and collaboration tools, even without design experience.

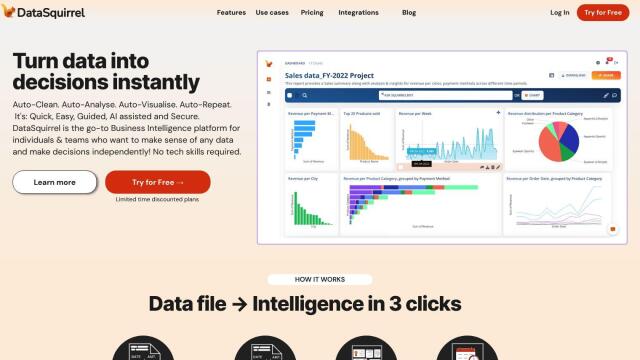
DataSquirrel screenshot thumbnail

DataSquirrel

Upload, clean, analyze, and visualize data with a few clicks, automating tasks to gain fast insights and make data-driven decisions independently.

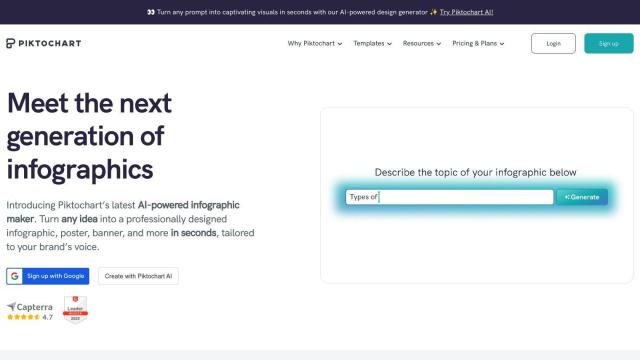
Piktochart screenshot thumbnail

Piktochart

Create professional-looking designs without design skills, leveraging a drag-and-drop editor, data visualization, and customization options to produce engaging visual content.

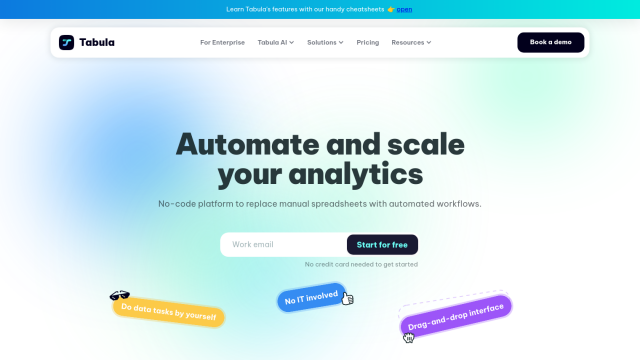
Tabula screenshot thumbnail

Tabula

Automate data workflows, standardize disparate sources, and gain real-time insights without coding, empowering data-driven decision-making across departments.

Genie screenshot thumbnail

Genie

Ask data questions in natural language and get instant answers and visualizations, without requiring complex SQL or technical expertise.

Vizzly screenshot thumbnail

Vizzly

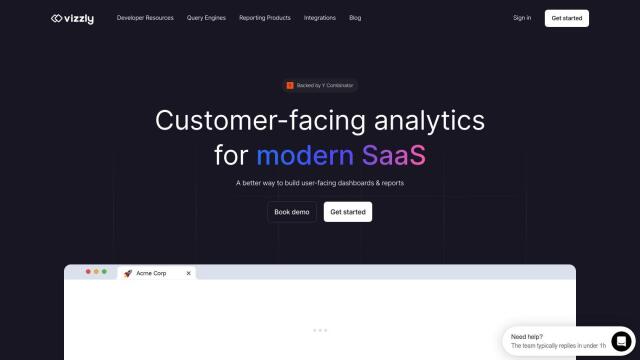
Build and share interactive, customizable analytics experiences with a no-code dashboard builder, empowering users to explore data without technical hassle.

Hex screenshot thumbnail

Hex

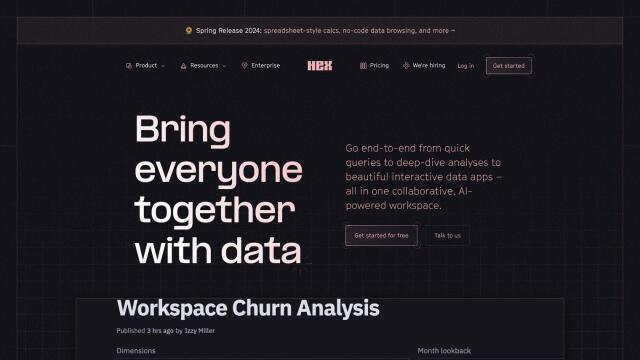
Unify data teams with AI-assisted exploration, collaboration, and interactive reporting, accelerating data work and improving accuracy in a single, modular workspace.

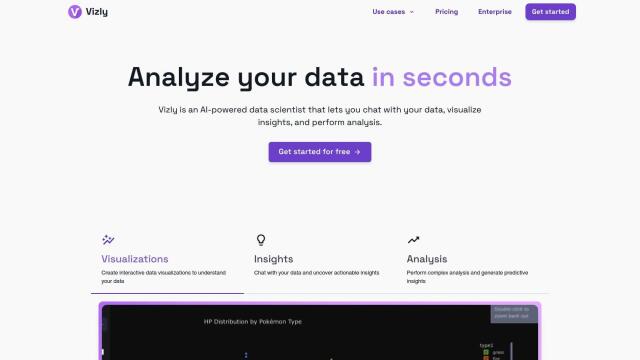
Vizly screenshot thumbnail

Vizly

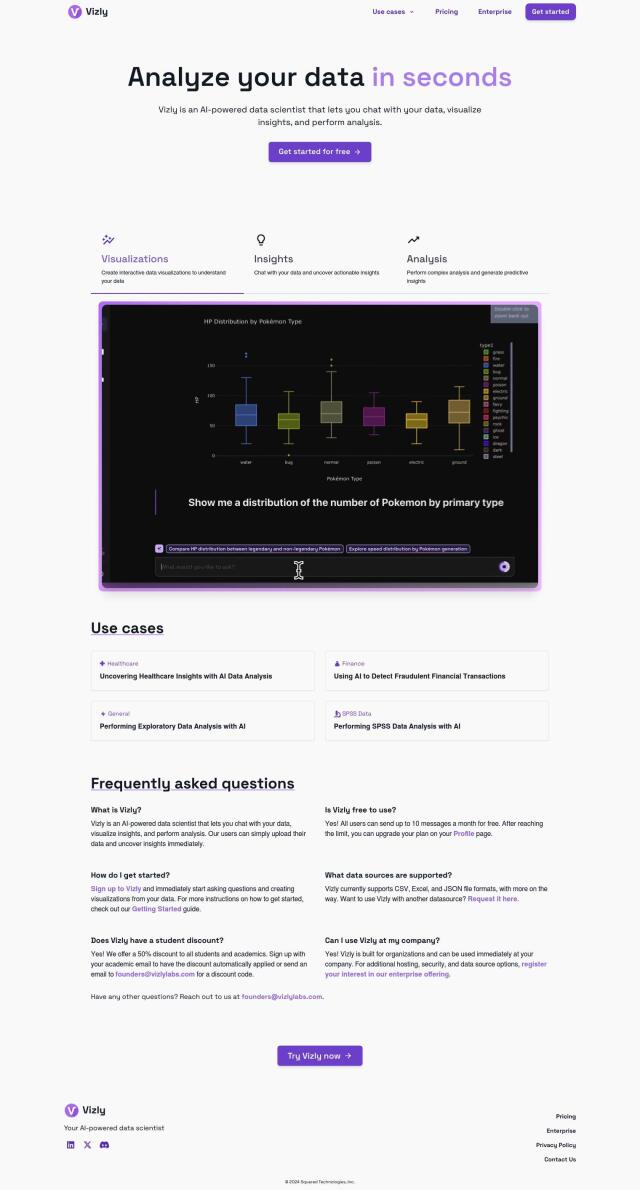
Interactively analyze data by asking questions, visualizing results, and performing advanced analysis to uncover insights and predictions.

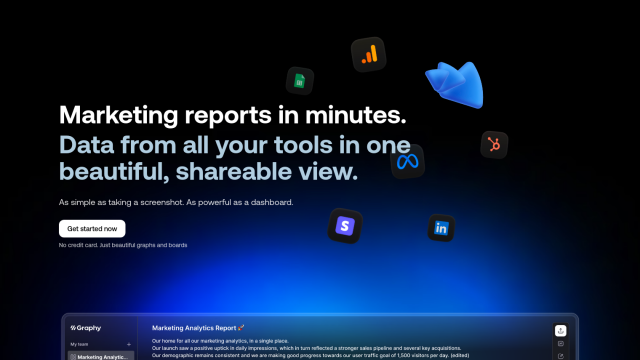
Graphy screenshot thumbnail

Graphy

Combine data from multiple sources into interactive, shareable reports in minutes, with AI-powered tools reducing creation time by 80%.

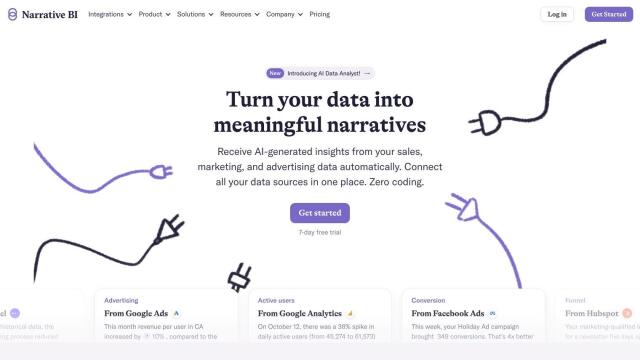
Narrative BI screenshot thumbnail

Narrative BI

Automatically generates personalized data narratives and alerts in plain language, transforming complex data into actionable insights for growth teams.

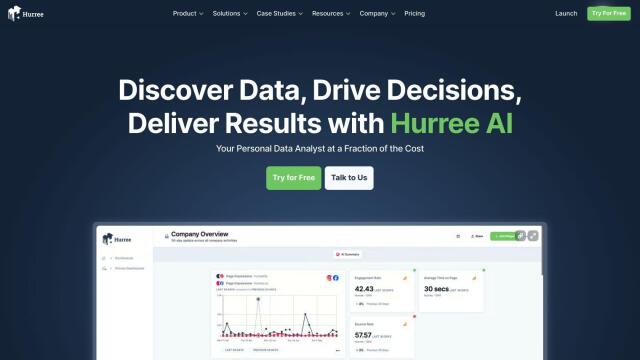
Hurree screenshot thumbnail

Hurree

Get instant insights without being a data expert, with one-click connections, centralized visualization, and AI-powered analysis transforming hours into clicks.

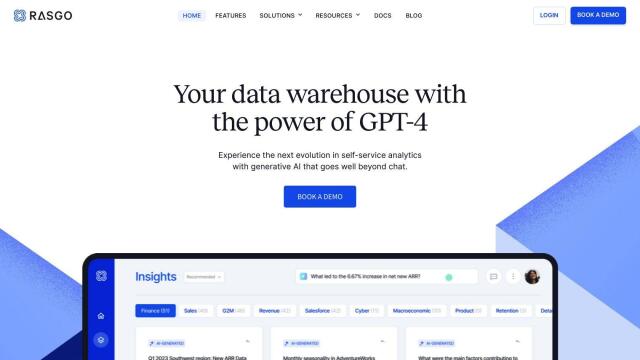
Rasgo screenshot thumbnail

Rasgo

Ask plain language questions and get instant, automated insights with 24/7 intelligent analysis, secured and customized with business context and visualizations.
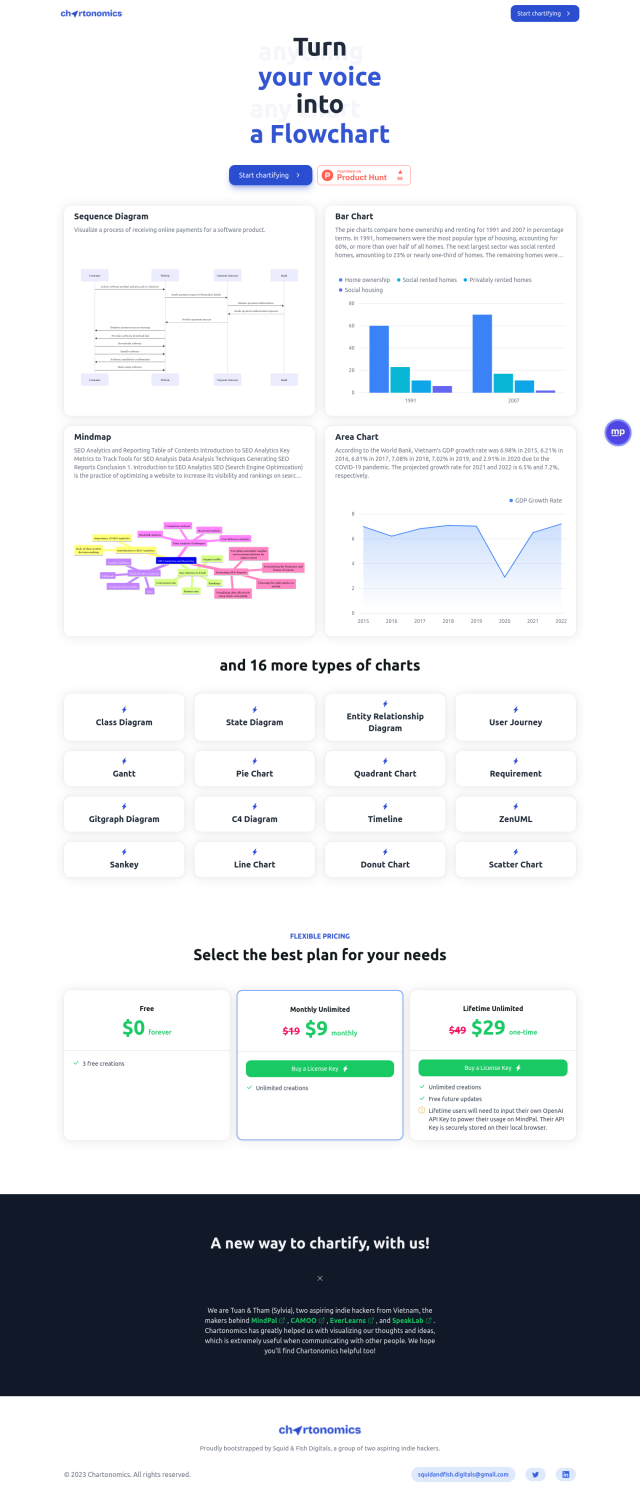
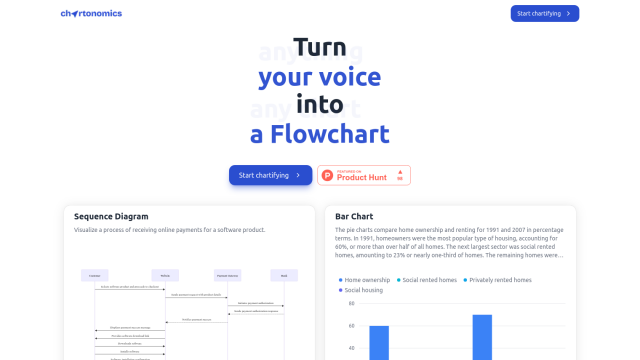
Chartonomics screenshot thumbnail

Chartonomics

Convert any data into 20+ chart types with a single click, no setup required, for instant visualization and communication of complex ideas.

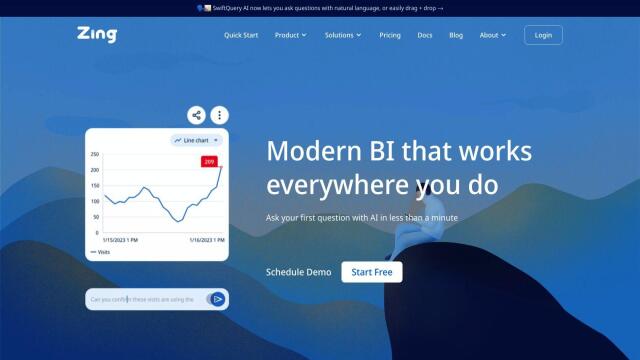
Zing Data screenshot thumbnail

Zing Data

Get answers to data questions in seconds, without expertise, using intuitive natural language querying and automated data modeling.

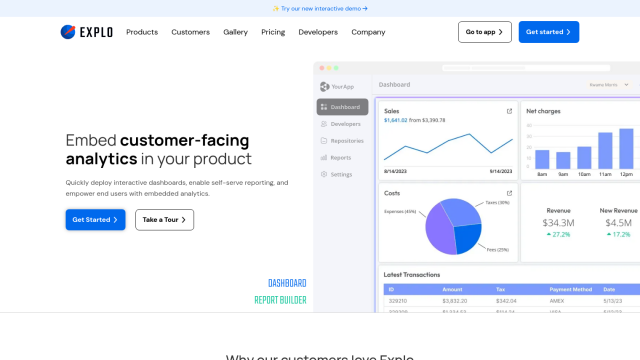
Explo screenshot thumbnail

Explo

Embed interactive dashboards and self-serve reporting directly into products, enabling end-users to customize analytics experiences and make better decisions.

Databar screenshot thumbnail

Databar

Connect to 1,000+ APIs without coding, automate workflows, and enrich data in real-time to power business operations across various industries.
Dataloop screenshot thumbnail

Dataloop

Unify data, models, and workflows in one environment, automating pipelines and incorporating human feedback to accelerate AI application development and improve quality.

Image Charts screenshot thumbnail

Image Charts

Automatically create custom charts from data, including line, pie, and scatter charts, with branding and embedding options for seamless integration.