Question: I need a service that can help me create charts and visualize data from my CSV files, can you recommend one?
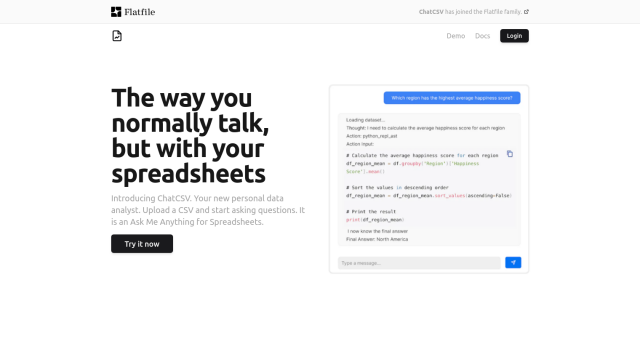
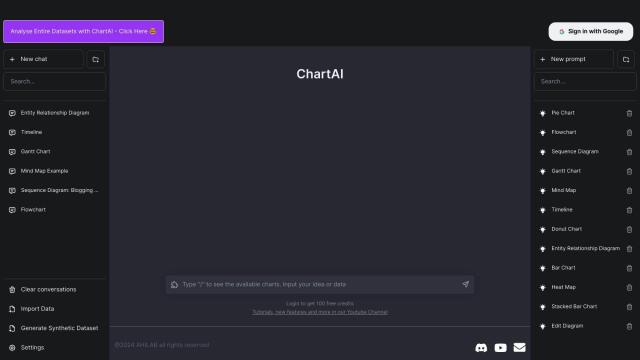
ChatCSV screenshot thumbnail

ChatCSV

If you need a service to create charts and visualize data in CSV files, ChatCSV is worth a look. The tool lets you ask questions of your CSV files in natural language and get answers in the form of bar charts, pie charts and other visualizations. It's geared for fields like retail, finance and marketing, but you can use it to explore and understand your data regardless of your background.
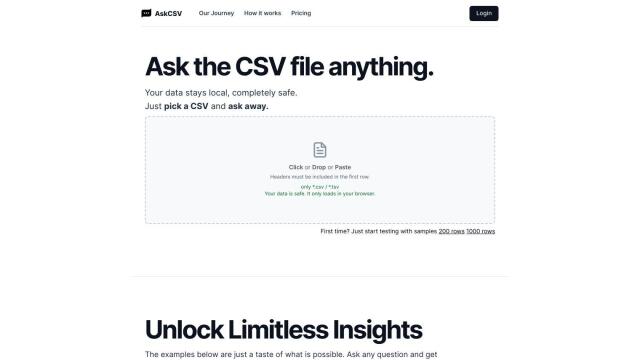
AskCSV screenshot thumbnail

AskCSV

Another good option is AskCSV, a browser-based tool that uses AI to create charts and offer suggestions from your CSV files without requiring you to upload your data. It's designed to protect your privacy and security by letting you select, drop or paste data from your own computer, and the service offers flexible pricing and export options.
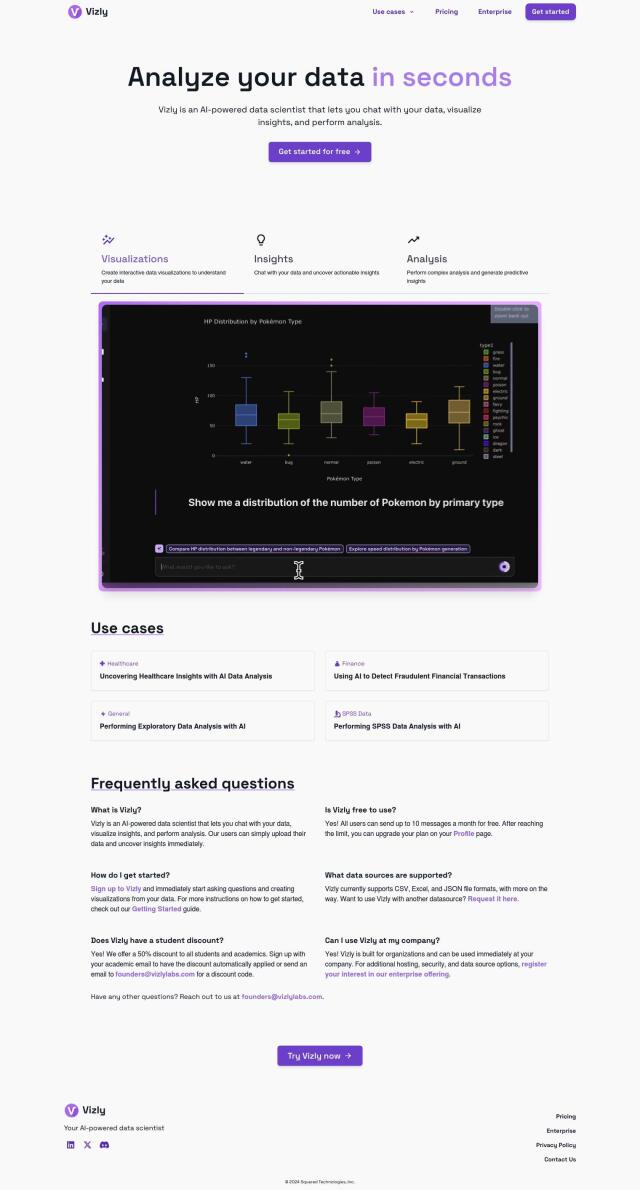
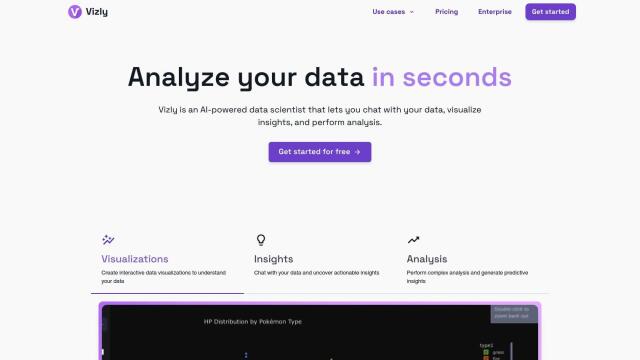
Luminal screenshot thumbnail

Luminal

For more serious data analysis and visualization, Luminal offers an AI-powered spreadsheet management tool that can import and process big data sets quickly. It has natural language prompts for cleaning, transforming and analyzing data, and can generate graphs and charts. Luminal has several pricing tiers, so it's good for casual users and serious analysts.
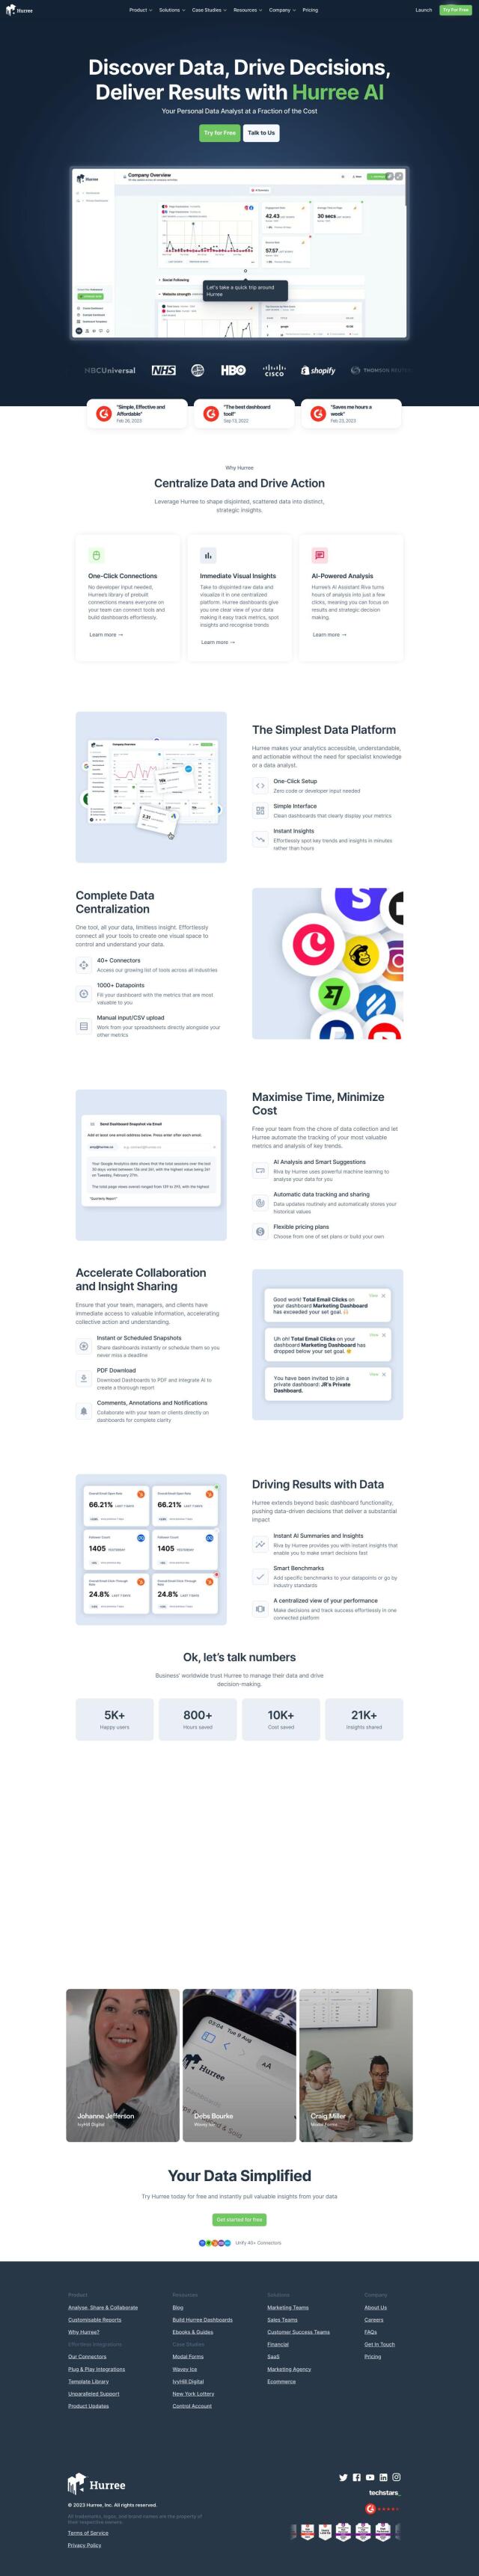
Onvo screenshot thumbnail

Onvo

Last, Onvo offers an AI-powered interface for generating interactive charts and dashboards with a few clicks. It can connect to multiple data sources, be customized and shared easily. Onvo is good for startups and companies that want to simplify their workflow and improve their data visualization.

Additional AI Projects

ChartAI screenshot thumbnail

ChartAI

Generate various charts and diagrams, including pie charts, flowcharts, and mind maps, from entire data sets with a user-friendly, ChatGPT-like interface.

Vizly screenshot thumbnail

Vizly

Interactively analyze data by asking questions, visualizing results, and performing advanced analysis to uncover insights and predictions.

Hurree screenshot thumbnail

Hurree

Get instant insights without being a data expert, with one-click connections, centralized visualization, and AI-powered analysis transforming hours into clicks.

Kanaries screenshot thumbnail

Kanaries

Explore and analyze data with a drag-and-drop interface, conversational insights, and seamless collaboration and sharing capabilities.

Spreadsheet.com screenshot thumbnail

Spreadsheet.com

Combines spreadsheet interface with automation, customizable views, and integrations to streamline project management, data tracking, and team collaboration.

TalktoData screenshot thumbnail

TalktoData

Ask questions in plain English and get immediate answers and visualizations from connected data sources, without needing to write code or wrangle data.

Canvas screenshot thumbnail

Canvas

Link, query, and visualize data from 150+ SaaS tools without coding, empowering non-technical teams to make data-informed decisions.

Formula Bot screenshot thumbnail

Formula Bot

Turns text into various outputs, including Excel formulas, SQL queries, and more, to accelerate data analysis and spreadsheet workflows.

Quadratic screenshot thumbnail

Quadratic

Combines spreadsheet comfort with Python, SQL, and AI power, enabling data scientists and analysts to process and visualize data with unprecedented flexibility.

Jeda.ai screenshot thumbnail

Jeda.ai

Collaborative, interactive canvas for creating, visualizing, and analyzing data, turning ideas into beautiful visuals and insights with advanced generative AI capabilities.

Chartonomics screenshot thumbnail

Chartonomics

Convert any data into 20+ chart types with a single click, no setup required, for instant visualization and communication of complex ideas.

Image Charts screenshot thumbnail

Image Charts

Automatically create custom charts from data, including line, pie, and scatter charts, with branding and embedding options for seamless integration.

DataSquirrel screenshot thumbnail

DataSquirrel

Upload, clean, analyze, and visualize data with a few clicks, automating tasks to gain fast insights and make data-driven decisions independently.

Ajelix screenshot thumbnail

Ajelix

Automate tasks, create formulas, and build dashboards with ease using AI-powered spreadsheet tools and a self-service BI platform.

ChatDB screenshot thumbnail

ChatDB

Query your database using natural language, with AI generating the necessary SQL, and create engaging charts for quick business insights.

Columns screenshot thumbnail

Columns

Collaborate on data visualization projects, manage data catalogs, and create compelling stories with AI-assisted insights, all in one self-service platform.

Hex screenshot thumbnail

Hex

Unify data teams with AI-assisted exploration, collaboration, and interactive reporting, accelerating data work and improving accuracy in a single, modular workspace.

Tabula screenshot thumbnail

Tabula

Automate data workflows, standardize disparate sources, and gain real-time insights without coding, empowering data-driven decision-making across departments.

Visme screenshot thumbnail

Visme

Create on-brand content fast with AI-assisted design, templates, and collaboration tools, even without design experience.

Piktochart screenshot thumbnail

Piktochart

Create professional-looking designs without design skills, leveraging a drag-and-drop editor, data visualization, and customization options to produce engaging visual content.