Question: Can you recommend a tool that helps identify and explain sudden drops in key performance indicators?

Loops
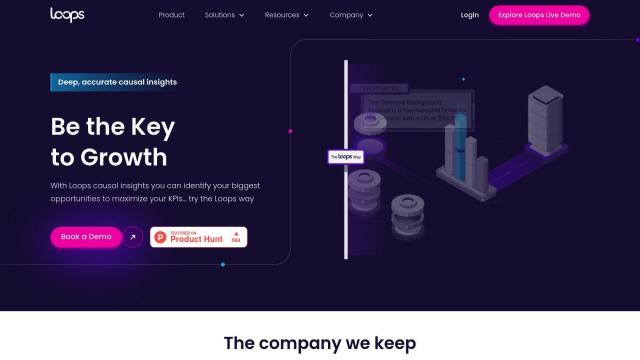
If you're looking for a tool to help you figure out what's behind sudden drops in key performance indicators, Loops could be a good choice. Loops uses causal insights to detect drops in KPIs and explain what's behind them -- for example, changes in traffic or the release of new features. It can connect to data sources like Google Analytics, Amplitude and Mixpanel, and it can track KPIs in real time, perform causal analysis and run simulated A/B tests. That makes it a good option for data analysts and product managers who want to make decisions and optimize their systems.

Honeycomb
Another strong contender is Honeycomb, an observability platform that's good at finding the source of problems in distributed services. It marries logs and metrics into a single workflow, with features like distributed tracing, smart data sampling and debuggable Service Level Objectives (SLOs). Honeycomb's platform is designed to help teams quickly get to the bottom of incidents and deploy with confidence, so it's a good option for finding and fixing performance problems as soon as they crop up.


Blobr
If you want to tap into the world of AI-powered insights, Blobr automates data analysis and can provide daily reports that help you figure out what's behind changes to KPIs. It can connect to marketing tools like Stripe, HubSpot and Google Analytics, and it's got natural language search and continuous AI learning. Blobr's proactive insights can free you from data analysis so you can focus on strategy, and it's a good option for marketing and sales teams.
Datadog
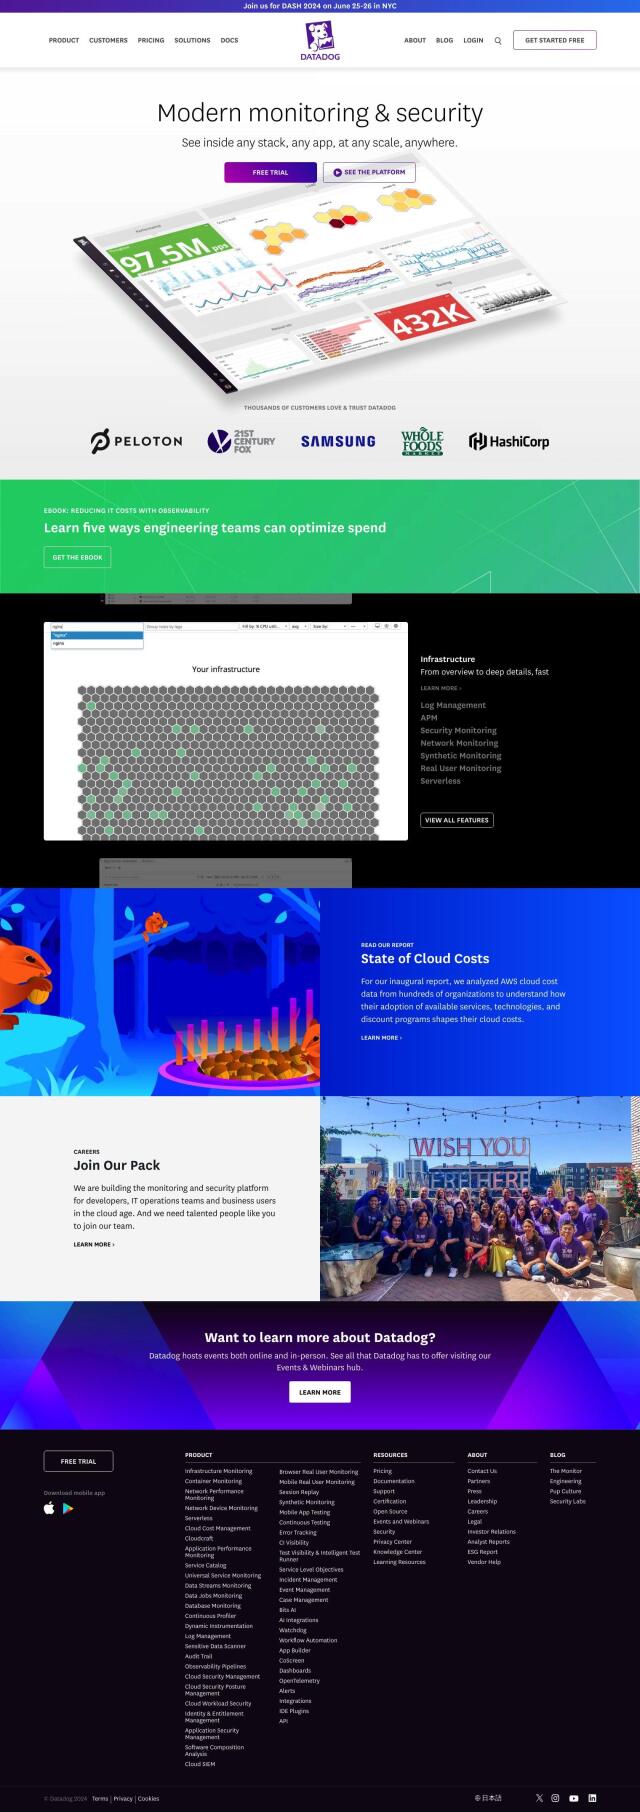
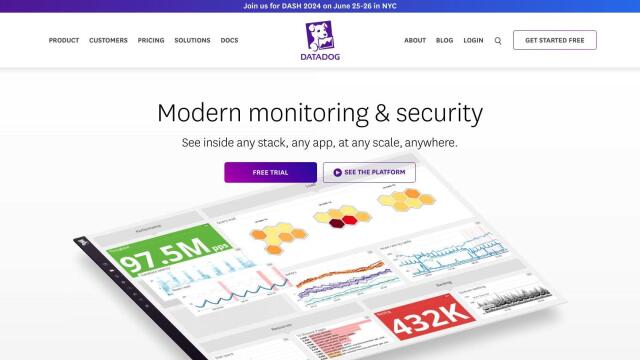
Last, Datadog is an all-purpose monitoring and security tool that offers real-time insights into performance, security and user experience. It's got a broad range of features, including infrastructure monitoring, application performance monitoring and synthetic monitoring. Datadog is good for a broad range of industries, and it lets you monitor your entire technology stack, so it's easy to find and optimize performance problems.

