Question: Is there a self-serve data visualization tool that enables teams to easily manage and share insights across the organization?
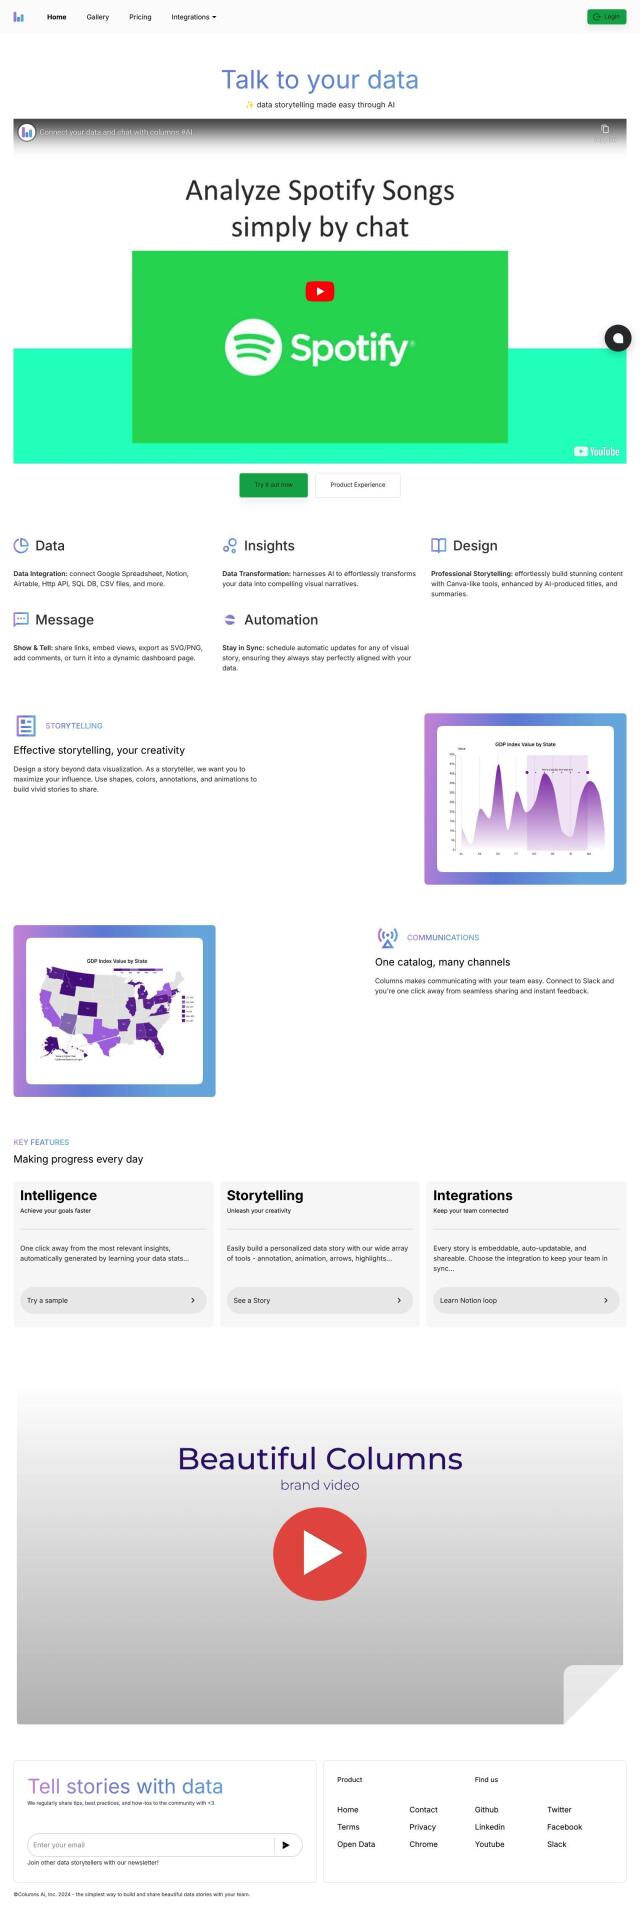
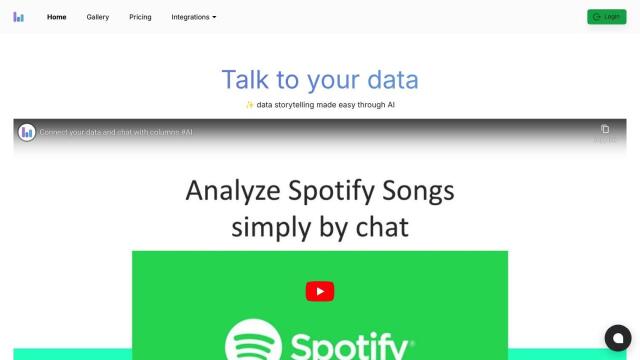
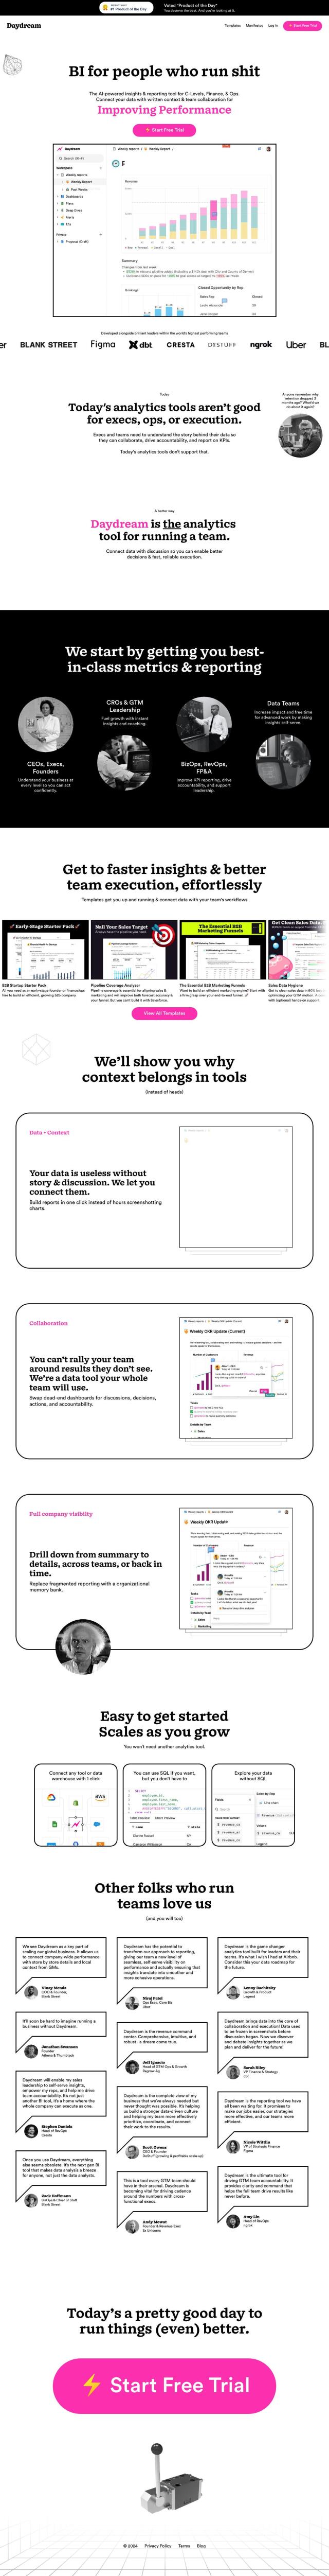
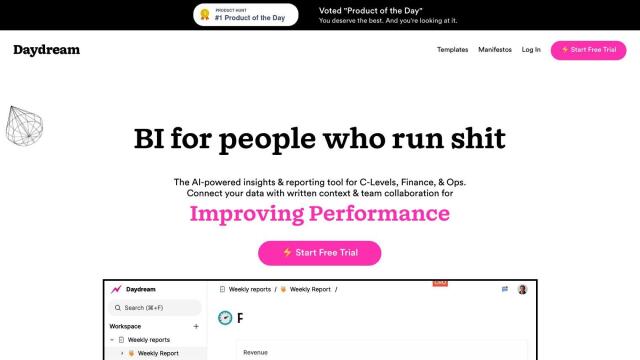
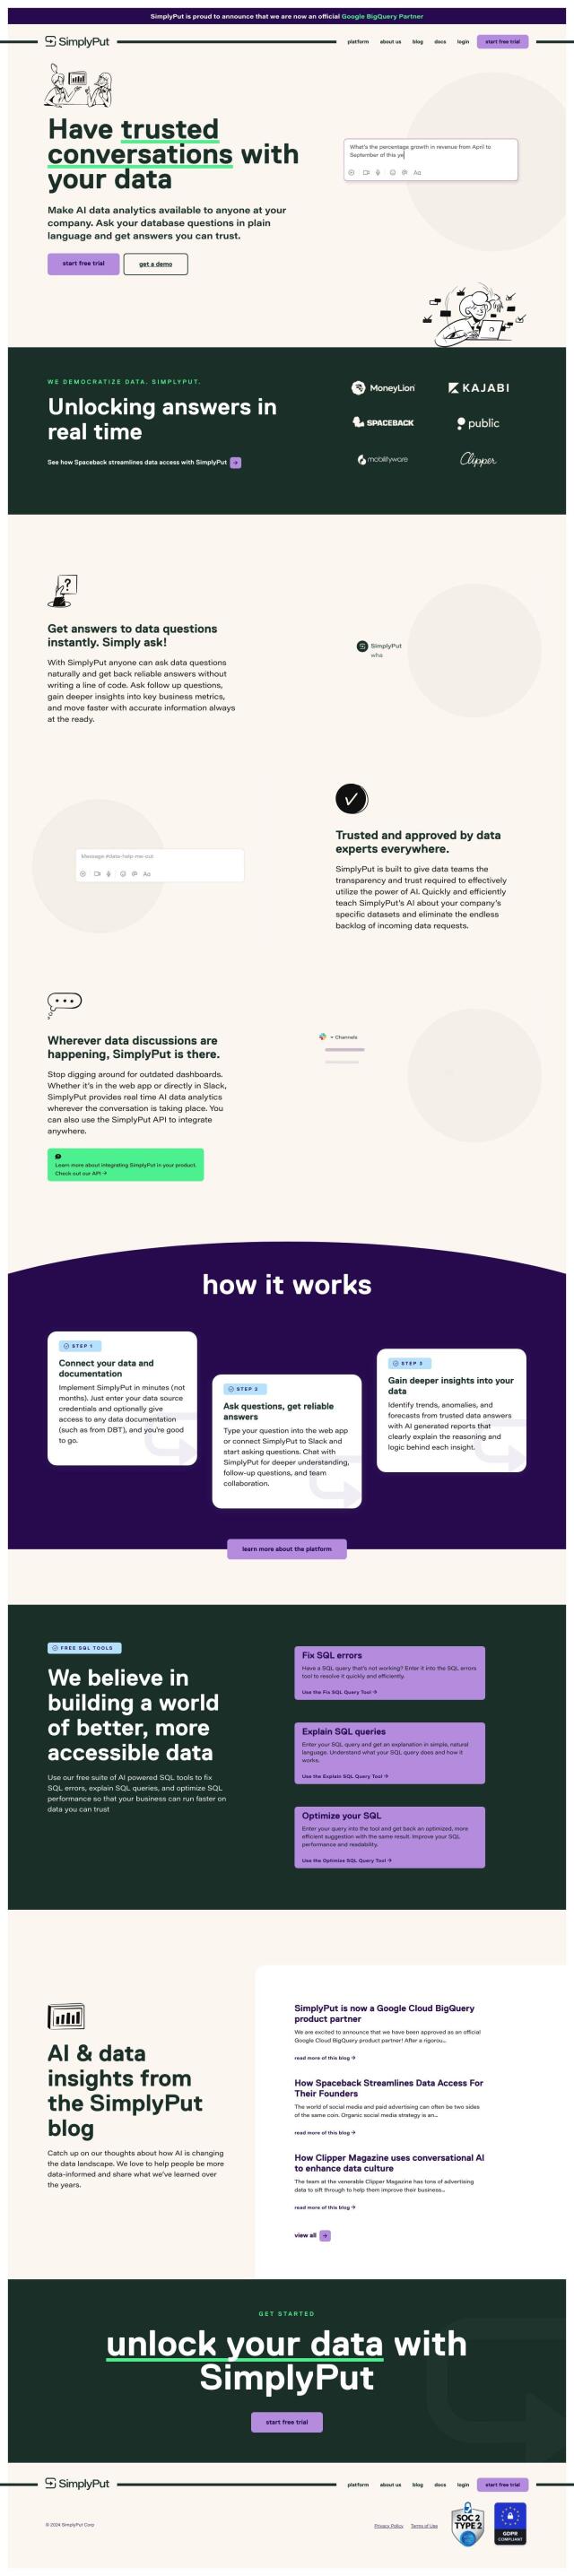
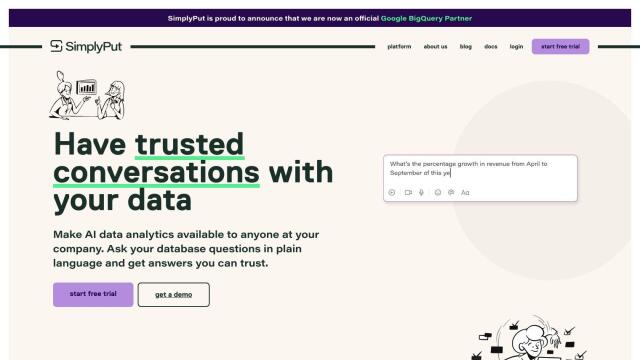
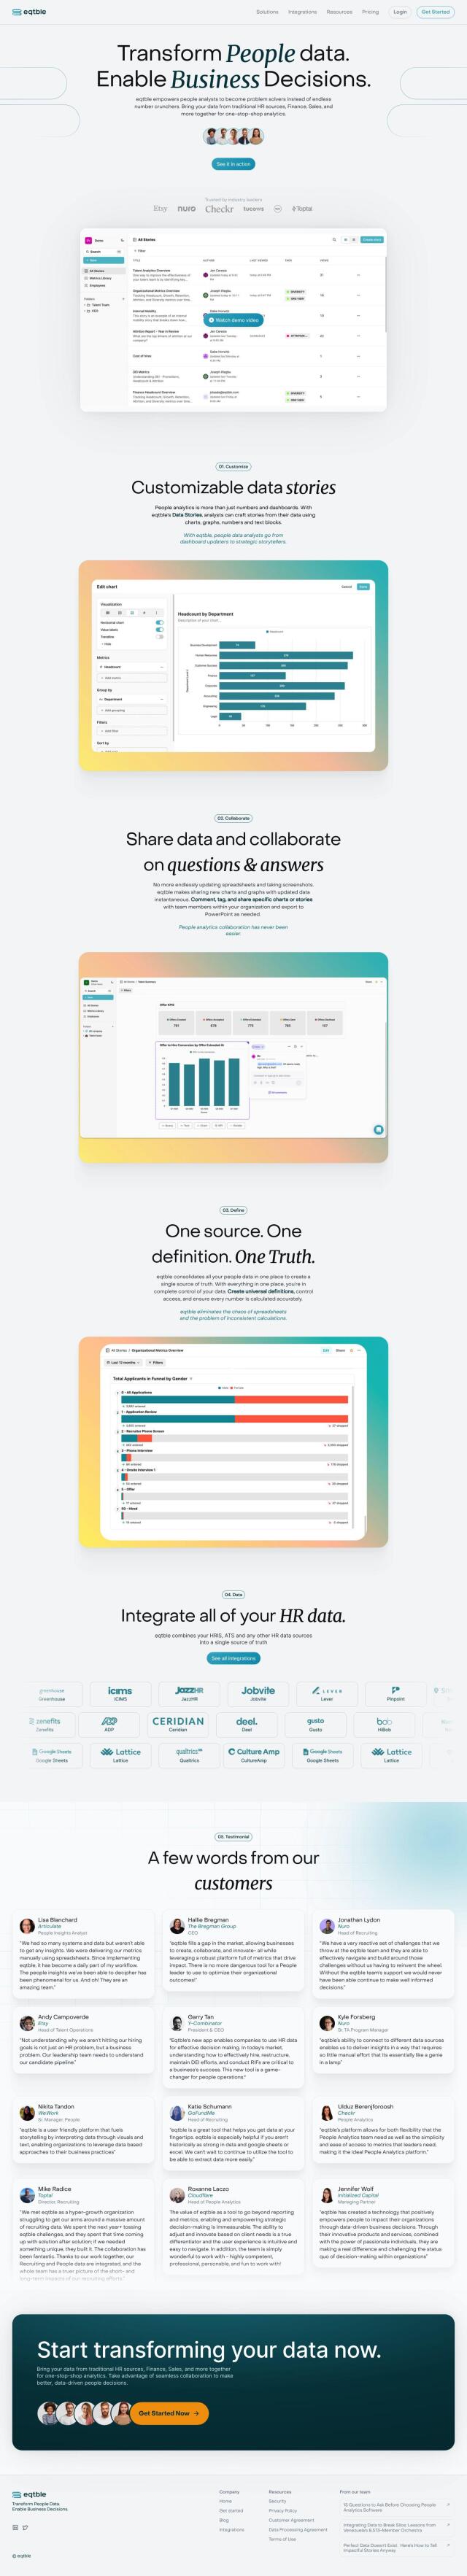
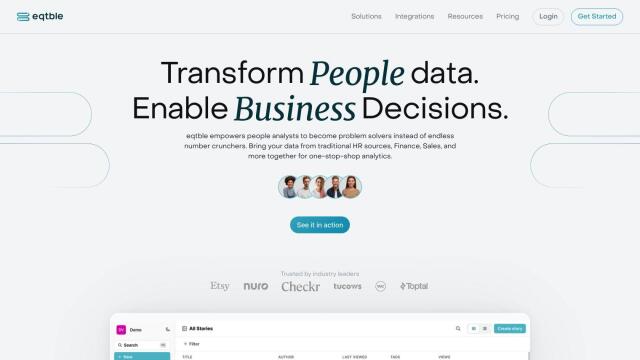
Columns screenshot thumbnail

Columns

If you need a self-serve data visualization tool to manage and share insights across your organization, Columns is a good choice. The tool lets people collaborate on data visualization projects using natural language and speech-based input, so it's good for teams with a mix of technical and non-technical people. Columns has fine-grained access controls, a data catalog that's easy to use, and self-serve data storytelling abilities that make it easier for teams to create and share data visualizations.
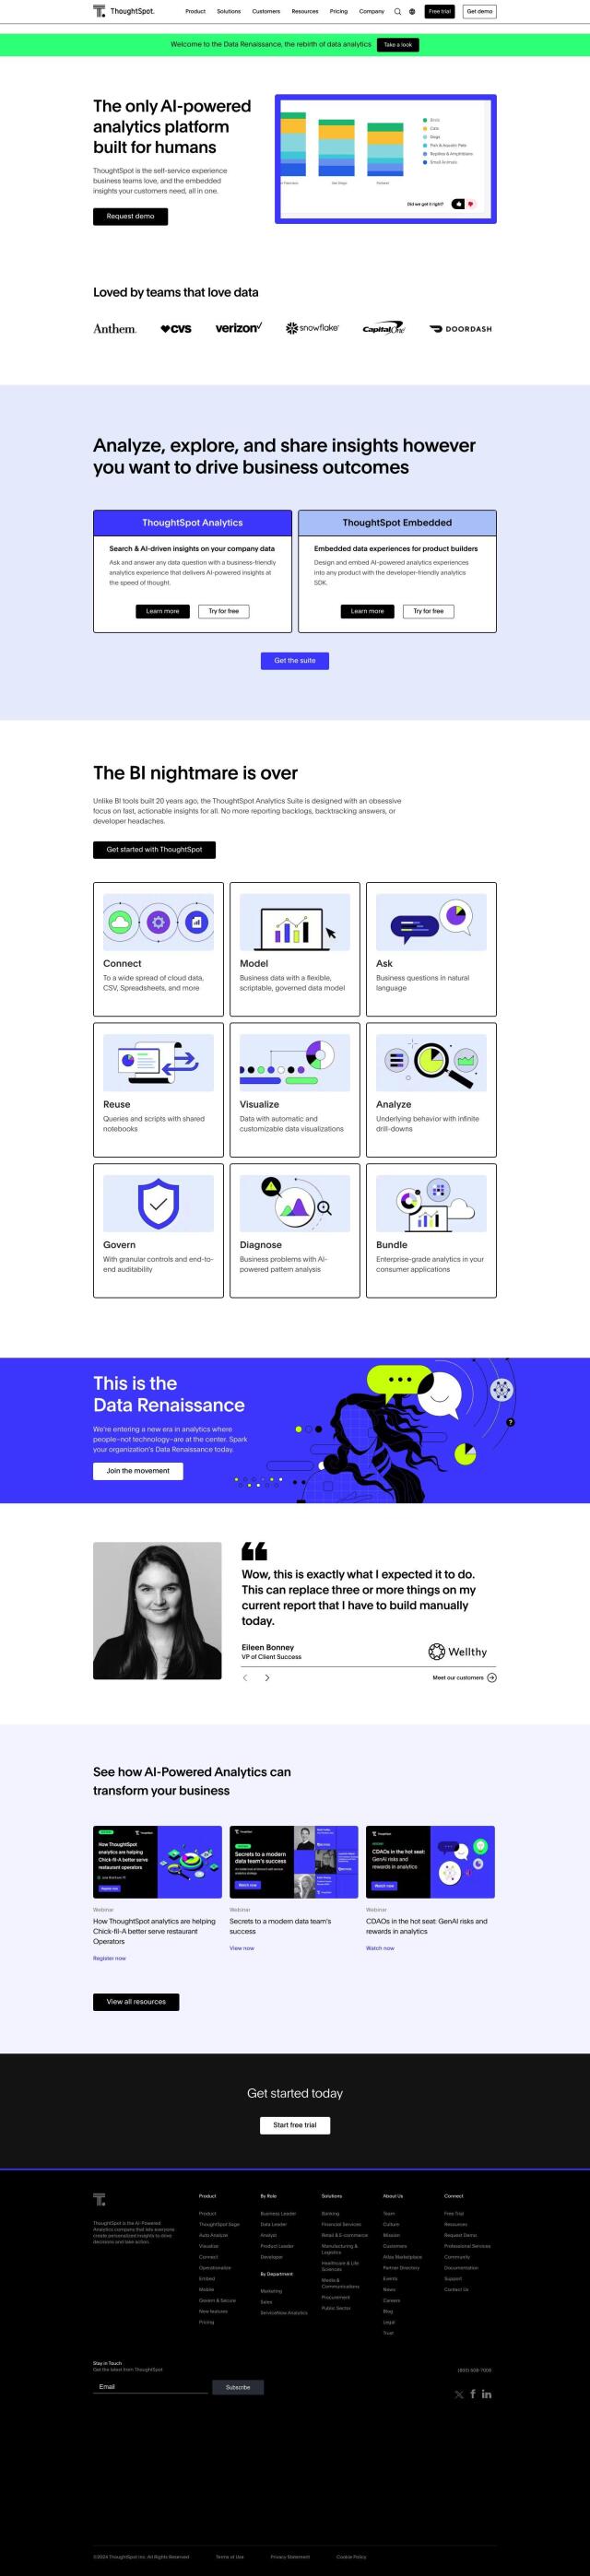
ThoughtSpot screenshot thumbnail

ThoughtSpot

Another good option is ThoughtSpot, an AI-infused analytics tool that lets people ask natural language questions to try to get data-driven answers. ThoughtSpot has search, AI-generated insights, embedded analytics and flexible data modeling. Its governance and security controls let administrators keep insights from getting out of hand, and it's a good option for teams that need analytics that can scale and that are secure.
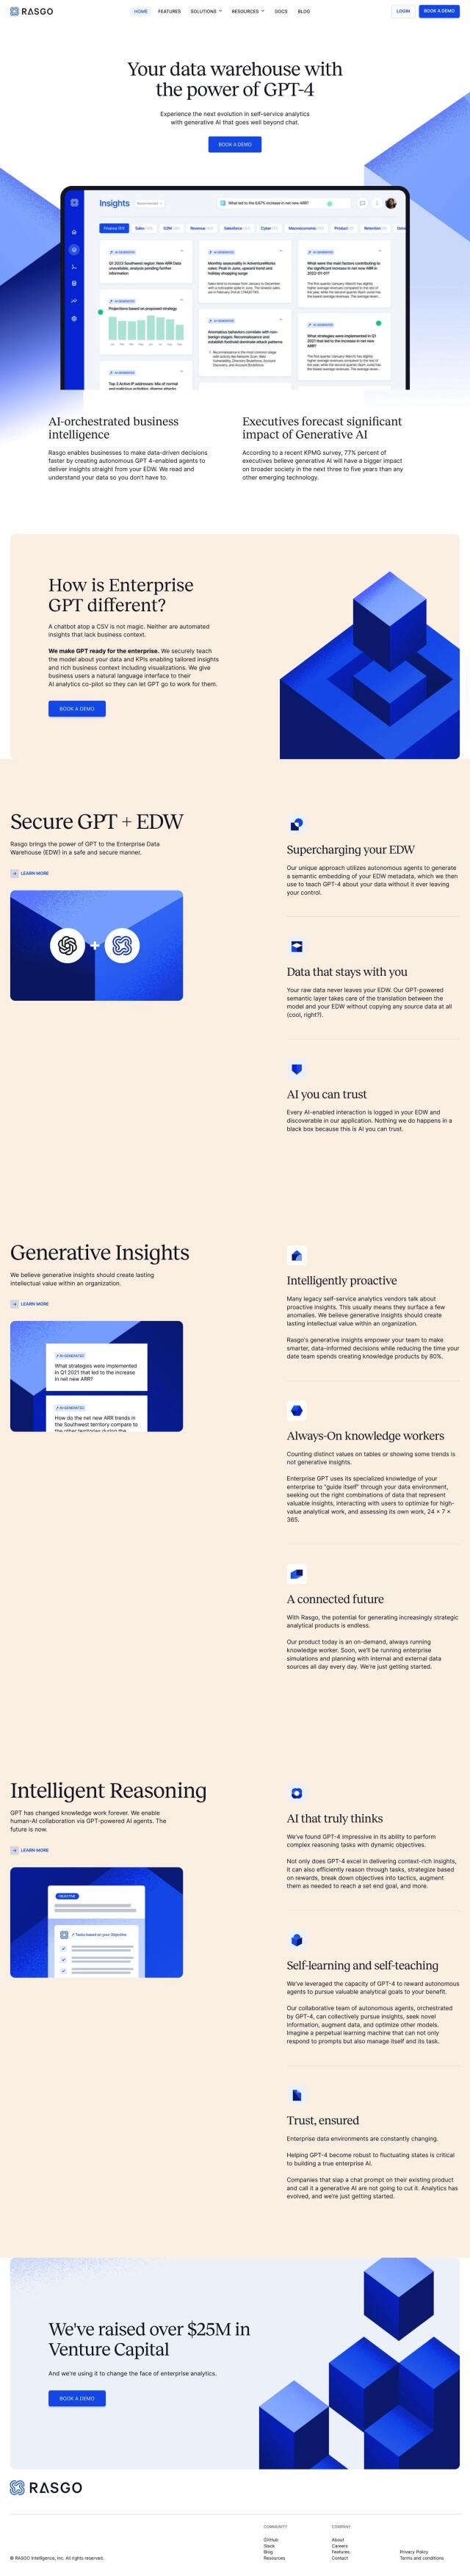
Rasgo screenshot thumbnail

Rasgo

If you need to tap into Enterprise Data Warehouses (EDWs) for analytics, Rasgo is a good option. The AI-infused tool lets people ask natural language questions and visualize data to get business insights. Its AI-orchestrated business intelligence approach means insights are secure and customized, which is good for finance teams and data teams trying to give business units self-service data insights.

Onvo screenshot thumbnail

Onvo

Last, Onvo is a simple tool for creating interactive charts and dashboards without having to write complex queries. With AI prompts for building dashboards and customization options to match brand identities, Onvo is good for startups and enterprises that want to speed up data visualization workflows. It can connect to a variety of data sources, including MongoDB, PostgreSQL and Google Sheets.

Additional AI Projects

Polymer screenshot thumbnail

Polymer

Converts complex data into intuitive, actionable visualizations, linking multiple sources and generating real-time insights with AI-driven analytics and suggested trends.

Vizzly screenshot thumbnail

Vizzly

Build and share interactive, customizable analytics experiences with a no-code dashboard builder, empowering users to explore data without technical hassle.

Canvas screenshot thumbnail

Canvas

Link, query, and visualize data from 150+ SaaS tools without coding, empowering non-technical teams to make data-informed decisions.

DataChat screenshot thumbnail

DataChat

Access complex data insights without coding, using a familiar chat and spreadsheet interface to generate transparent, reproducible results.

Explo screenshot thumbnail

Explo

Embed interactive dashboards and self-serve reporting directly into products, enabling end-users to customize analytics experiences and make better decisions.

Hex screenshot thumbnail

Hex

Unify data teams with AI-assisted exploration, collaboration, and interactive reporting, accelerating data work and improving accuracy in a single, modular workspace.

Hurree screenshot thumbnail

Hurree

Get instant insights without being a data expert, with one-click connections, centralized visualization, and AI-powered analysis transforming hours into clicks.

Airbook screenshot thumbnail

Airbook

Accelerate data analysis and insights generation across teams with native connectors to 150+ data sources, collaborative querying, and visualization tools.

Graphy screenshot thumbnail

Graphy

Combine data from multiple sources into interactive, shareable reports in minutes, with AI-powered tools reducing creation time by 80%.

Tabula screenshot thumbnail

Tabula

Automate data workflows, standardize disparate sources, and gain real-time insights without coding, empowering data-driven decision-making across departments.

Jeda.ai screenshot thumbnail

Jeda.ai

Collaborative, interactive canvas for creating, visualizing, and analyzing data, turning ideas into beautiful visuals and insights with advanced generative AI capabilities.

DataSquirrel screenshot thumbnail

DataSquirrel

Upload, clean, analyze, and visualize data with a few clicks, automating tasks to gain fast insights and make data-driven decisions independently.

Breadcrumb screenshot thumbnail

Breadcrumb

Transform data into interactive AI dashboards, connecting multiple sources, and track trends in real-time with 100% accurate visualizations and natural language queries.

Visme screenshot thumbnail

Visme

Create on-brand content fast with AI-assisted design, templates, and collaboration tools, even without design experience.

DataGPT screenshot thumbnail

DataGPT

Get instant, analyst-level answers to data questions in seconds, with automated insights and visualizations, making complex data analysis accessible to everyone.

Daydream screenshot thumbnail

Daydream

Unify data, context, and team collaboration to drive informed decisions, with AI-powered connections and expert-built templates for instant business insights.

Embeddable screenshot thumbnail

Embeddable

Craft compelling customer-facing analytics experiences and embed them directly into your application, with full control and flexibility, in a fraction of the time.

SimplyPut screenshot thumbnail

SimplyPut

Ask data questions in plain language and get trusted answers without coding, with real-time analytics and AI-powered insights into trends, anomalies, and forecasts.

Trevor screenshot thumbnail

Trevor

Enables non-technical teams to easily extract insights from data without SQL knowledge, through a simple interface and interactive dashboards.

eqtble screenshot thumbnail

eqtble

Centralizes people data from various sources, enabling analysts to create data-driven stories and collaborate with others to drive informed decision-making.