Question: I'm looking for a way to add interactive visualizations to my app without building from scratch, what are my options?

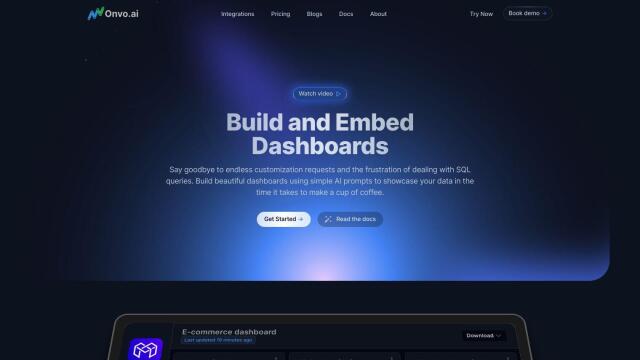
Onvo screenshot thumbnail

Onvo

If you want a way to add interactive visualization to your app without having to start from scratch, Onvo is a good choice. This AI-based data visualization service lets people create interactive charts and dashboards with AI prompts. It integrates with a variety of data sources, can be customized to match your brand identity, and offers features like personalized analysis and workflow automation. Onvo is geared for startups and enterprises.

Embeddable screenshot thumbnail

Embeddable

Another good option is Embeddable, which offers a library to build and embed interactive analytics into your apps. It includes custom React.js components, integration with your existing design systems, and support for libraries like ChartJS and D3. With next-gen embedding, sub-second response times and customizable caching, Embeddable delivers fast and secure analytics experiences.

Vizzly screenshot thumbnail

Vizzly

Vizzly is geared for modern SaaS companies that want to build and share interactive analytics experiences fast. It includes a no-code builder and customizable dashboards with self-serve reporting abilities. Vizzly can connect to most SQL databases and offers native SDK-based embedding so you can add analytics abilities with minimal technical setup.

Additional AI Projects

Explo screenshot thumbnail

Explo

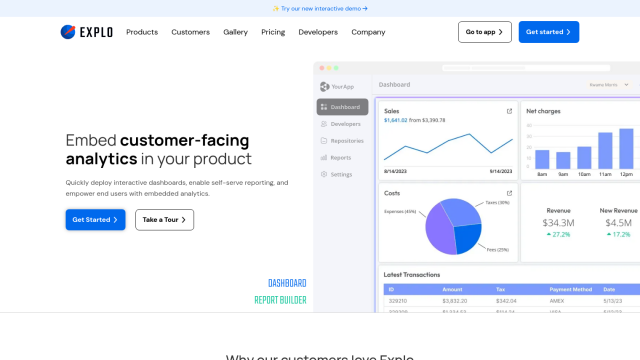
Embed interactive dashboards and self-serve reporting directly into products, enabling end-users to customize analytics experiences and make better decisions.

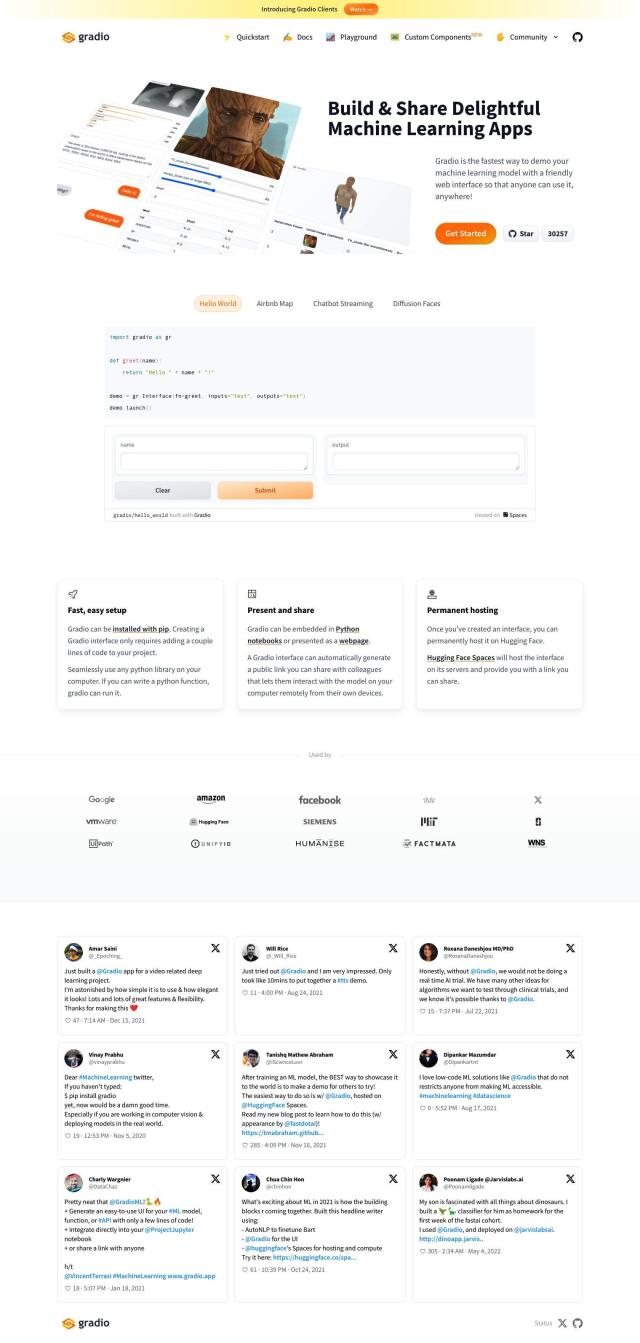
Gradio screenshot thumbnail

Gradio

Convert Python functions into interactive, web-based demos with a simple interface, shareable via public URL, and customizable with various components.

Polymer screenshot thumbnail

Polymer

Converts complex data into intuitive, actionable visualizations, linking multiple sources and generating real-time insights with AI-driven analytics and suggested trends.

Jeda.ai screenshot thumbnail

Jeda.ai

Collaborative, interactive canvas for creating, visualizing, and analyzing data, turning ideas into beautiful visuals and insights with advanced generative AI capabilities.

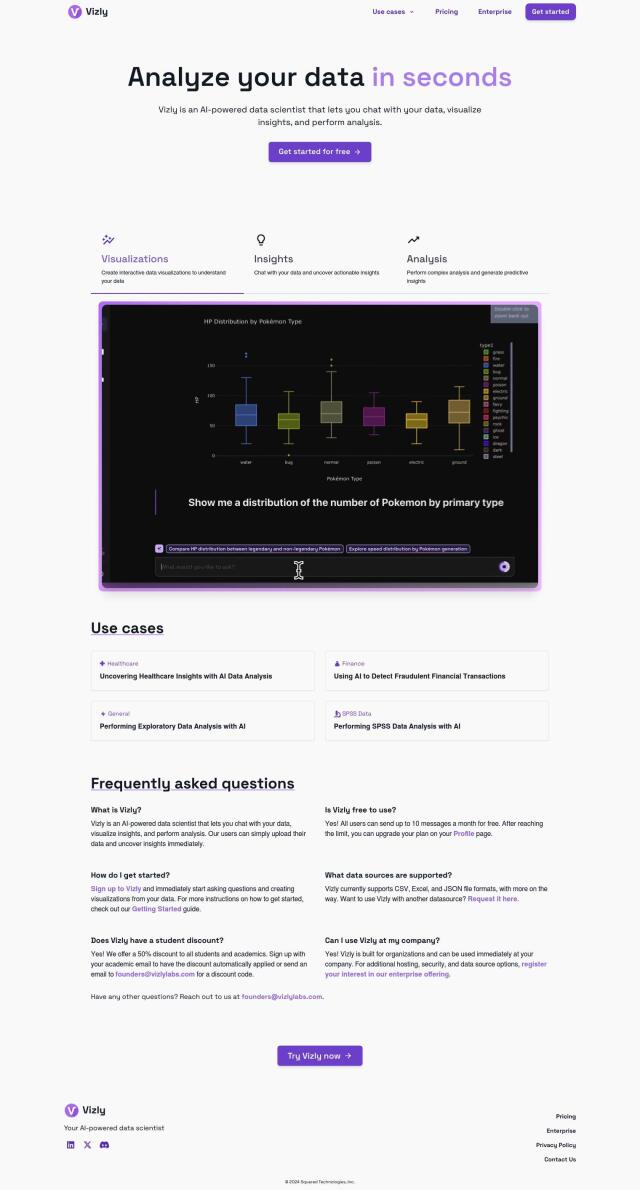
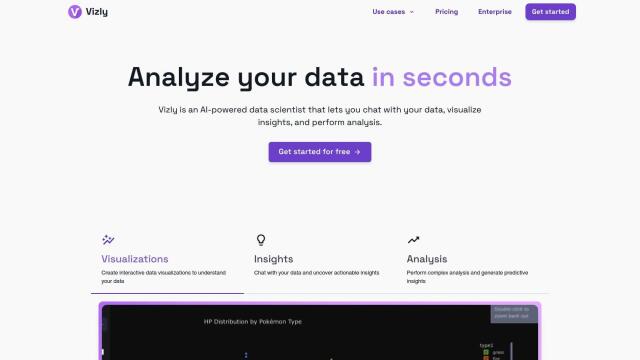
Vizly screenshot thumbnail

Vizly

Interactively analyze data by asking questions, visualizing results, and performing advanced analysis to uncover insights and predictions.

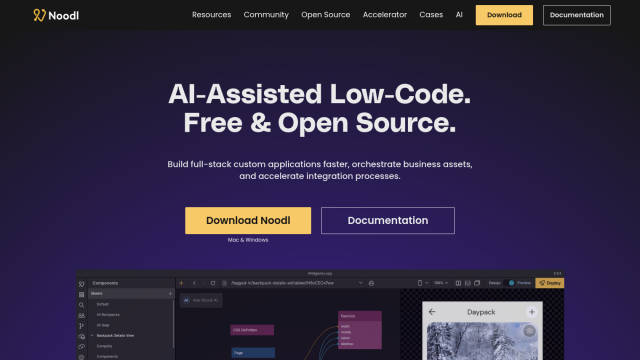
Noodl screenshot thumbnail

Noodl

Build full-stack applications quickly with a visual development tool that integrates AI-generated building blocks, database queries, and UI elements for rapid iteration.

Visme screenshot thumbnail

Visme

Create on-brand content fast with AI-assisted design, templates, and collaboration tools, even without design experience.

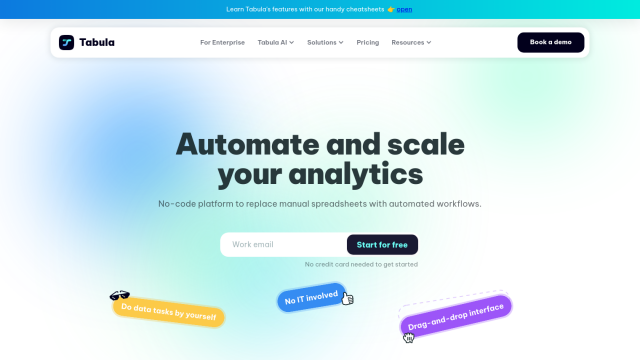
Tabula screenshot thumbnail

Tabula

Automate data workflows, standardize disparate sources, and gain real-time insights without coding, empowering data-driven decision-making across departments.

Chartonomics screenshot thumbnail

Chartonomics

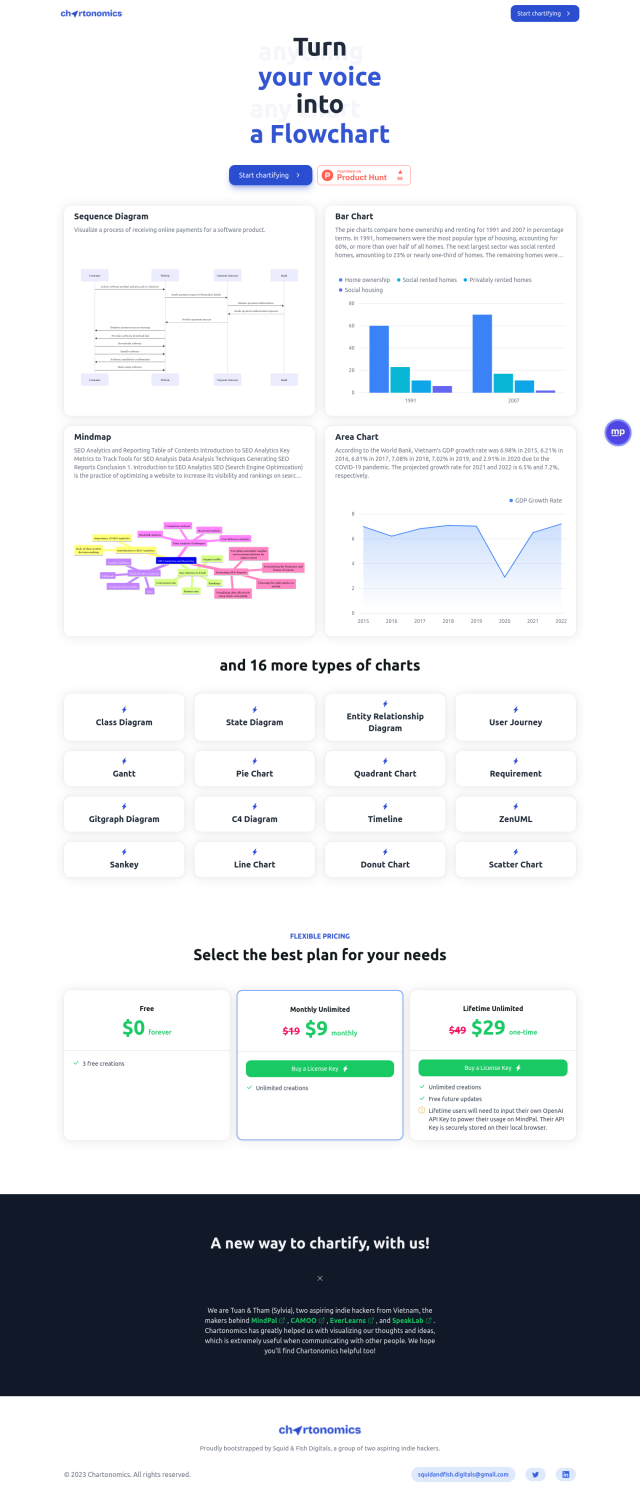
Convert any data into 20+ chart types with a single click, no setup required, for instant visualization and communication of complex ideas.

Slatebox screenshot thumbnail

Slatebox

Create editable visualizations from natural language prompts in real-time, fostering efficient team collaboration and diagram creation.

Piktochart screenshot thumbnail

Piktochart

Create professional-looking designs without design skills, leveraging a drag-and-drop editor, data visualization, and customization options to produce engaging visual content.

Rive screenshot thumbnail

Rive

Create interactive motion graphics with a visual state machine, real-time animation, and a design tool that generates working graphics for apps, games, and websites.

Canvas screenshot thumbnail

Canvas

Link, query, and visualize data from 150+ SaaS tools without coding, empowering non-technical teams to make data-informed decisions.

Latitude screenshot thumbnail

Latitude

Automatically generate API endpoints from SQL queries, deploy scalable analytics, and embed interactive visualizations with a lightweight, modular framework.

Opinion Stage screenshot thumbnail

Opinion Stage

Create interactive visual quizzes, polls, and surveys with AI-assisted creation, personalization, and skip logic for more targeted results and increased engagement.

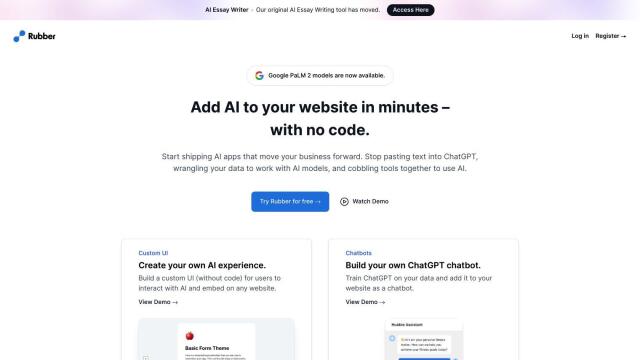
Rubber screenshot thumbnail

Rubber

Build AI-powered apps without coding, using a library of building blocks to create intuitive and powerful apps, with customizable UI and seamless integrations.

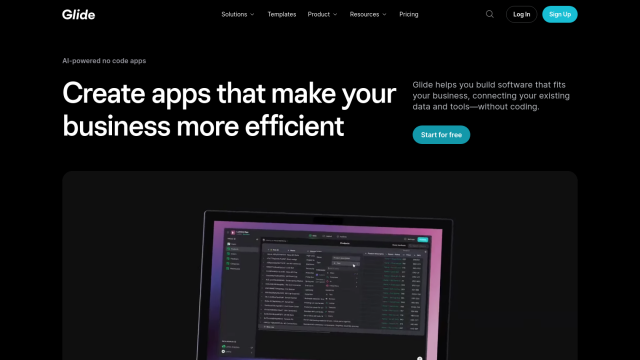
Glide screenshot thumbnail

Glide

Build custom apps powered by AI without coding, integrating with existing data and deploying to any device with self-designing layouts.

Imagica screenshot thumbnail

Imagica

Build AI-powered apps without coding, using a no-code interface that lets you define functions with plain language and integrate real-time data sources.

Avataar screenshot thumbnail

Avataar

Create immersive 3D stories and videos with a fluid blend of digital and real-world elements, leveraging AI for easy model generation and cost savings.

Visily screenshot thumbnail

Visily

Create high-fidelity wireframes and prototypes without design expertise, using AI-powered tools that turn text, screenshots, and sketches into editable designs instantly.

Interval screenshot thumbnail

Interval

Turns Node.js or Python code into full-fledged web apps, generating UI code in the browser, so you can focus on business logic.