Question: I need a tool that can help me create interactive and informative data visualizations from large datasets, can you suggest something?
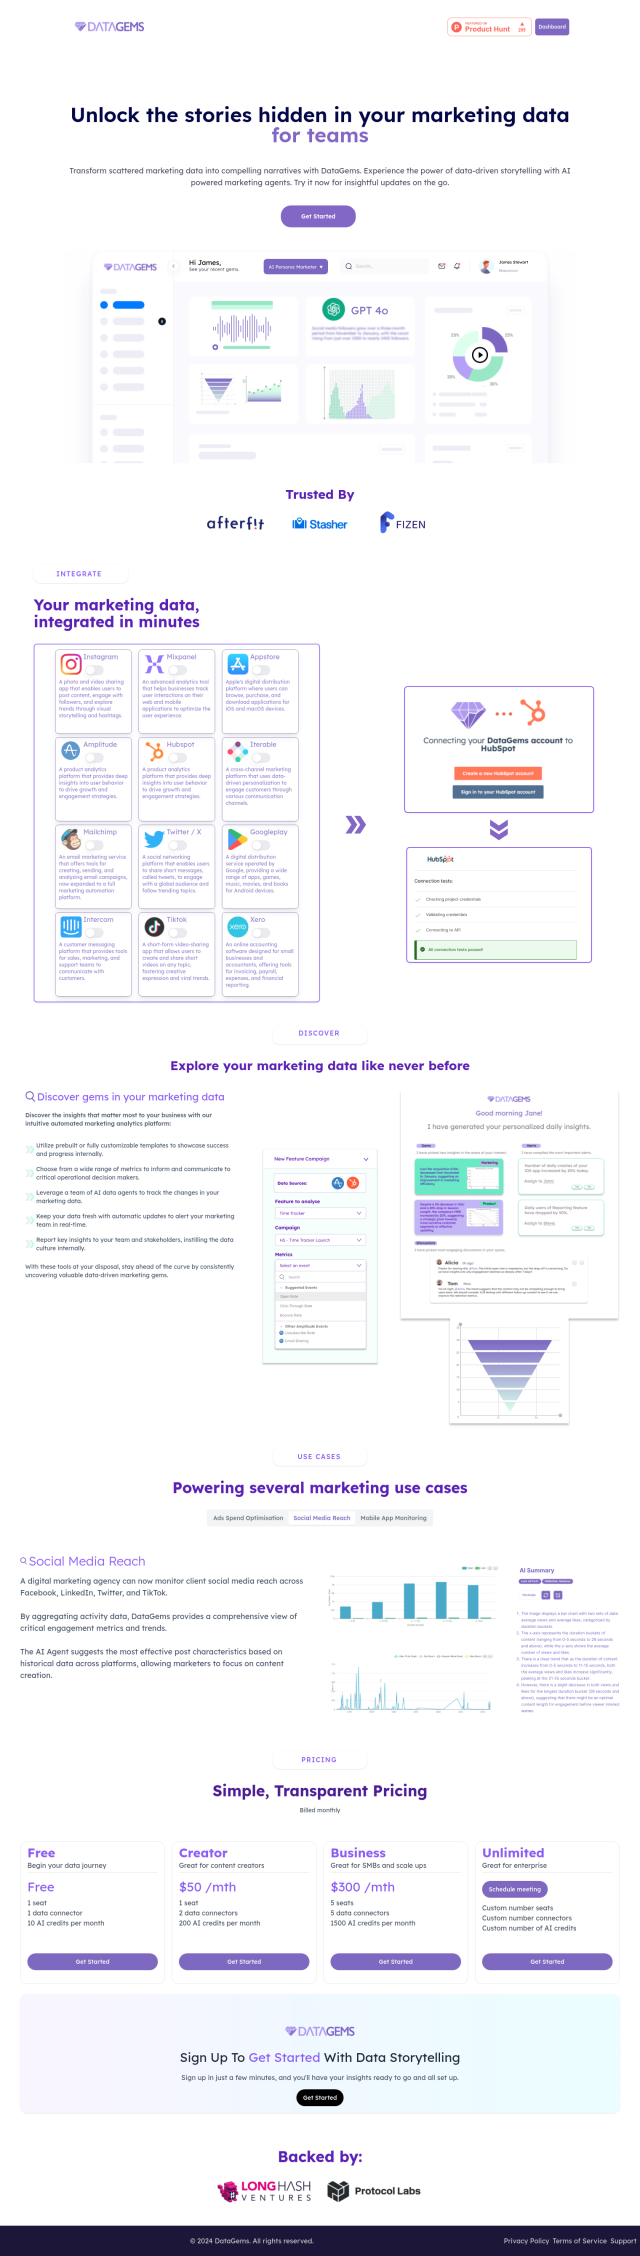
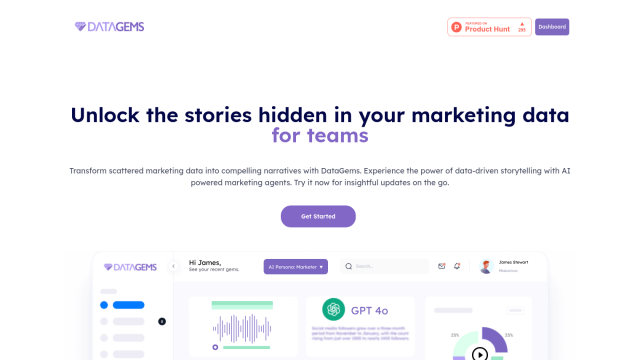
Polymer screenshot thumbnail

Polymer

For turning complex data into interactive, informative visualizations, Polymer is a good option. This AI-powered tool can transform complex data into insights and link multiple data sources to create a dashboard in no time. It offers AI-driven insights, personalized visualization, pre-built templates and real-time updates, so a wide range of users can easily analyze and visualize data.
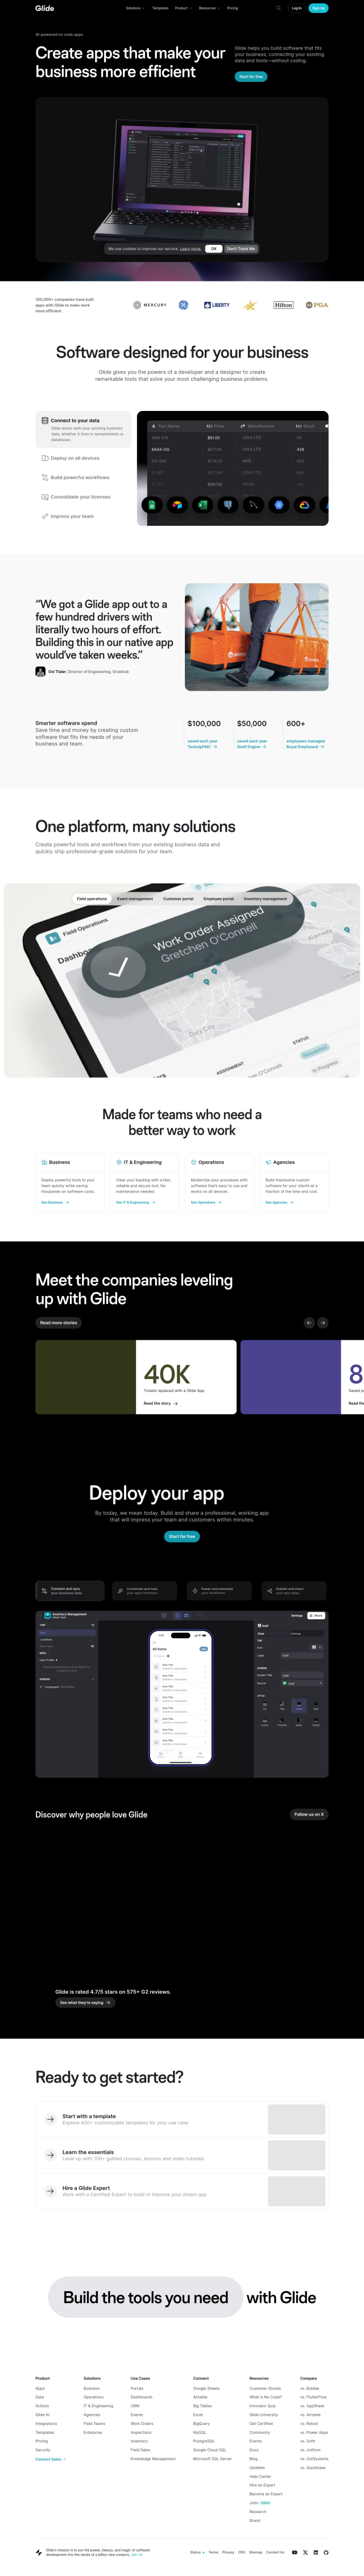
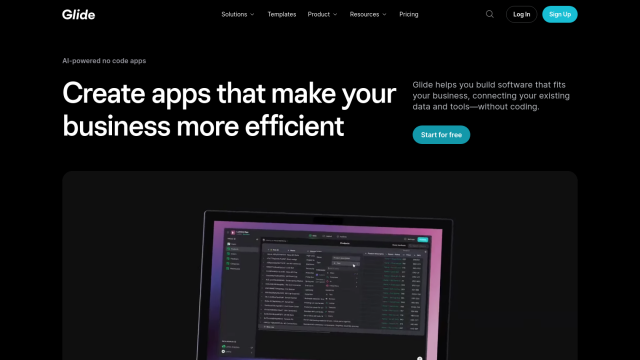
Tabula screenshot thumbnail

Tabula

Another option is Tabula, a no-code platform that lets business and data teams join, transform and visualize data. It integrates with common data tools and offers automated workflows, custom metrics and real-time insights. Tabula is good for analytics, marketing and finance teams, and offers an interface that provides immediate feedback.

Graphy screenshot thumbnail

Graphy

Graphy is geared for data-driven marketers and teams, letting them create interactive reports from different sources in a matter of minutes. With one-click data import, customizable visualization and AI-assisted productivity, Graphy automates reporting and helps stakeholders understand the data. It's good for weekly and monthly reports, and you can embed insights into tools like Notion, Slack or PowerPoint.
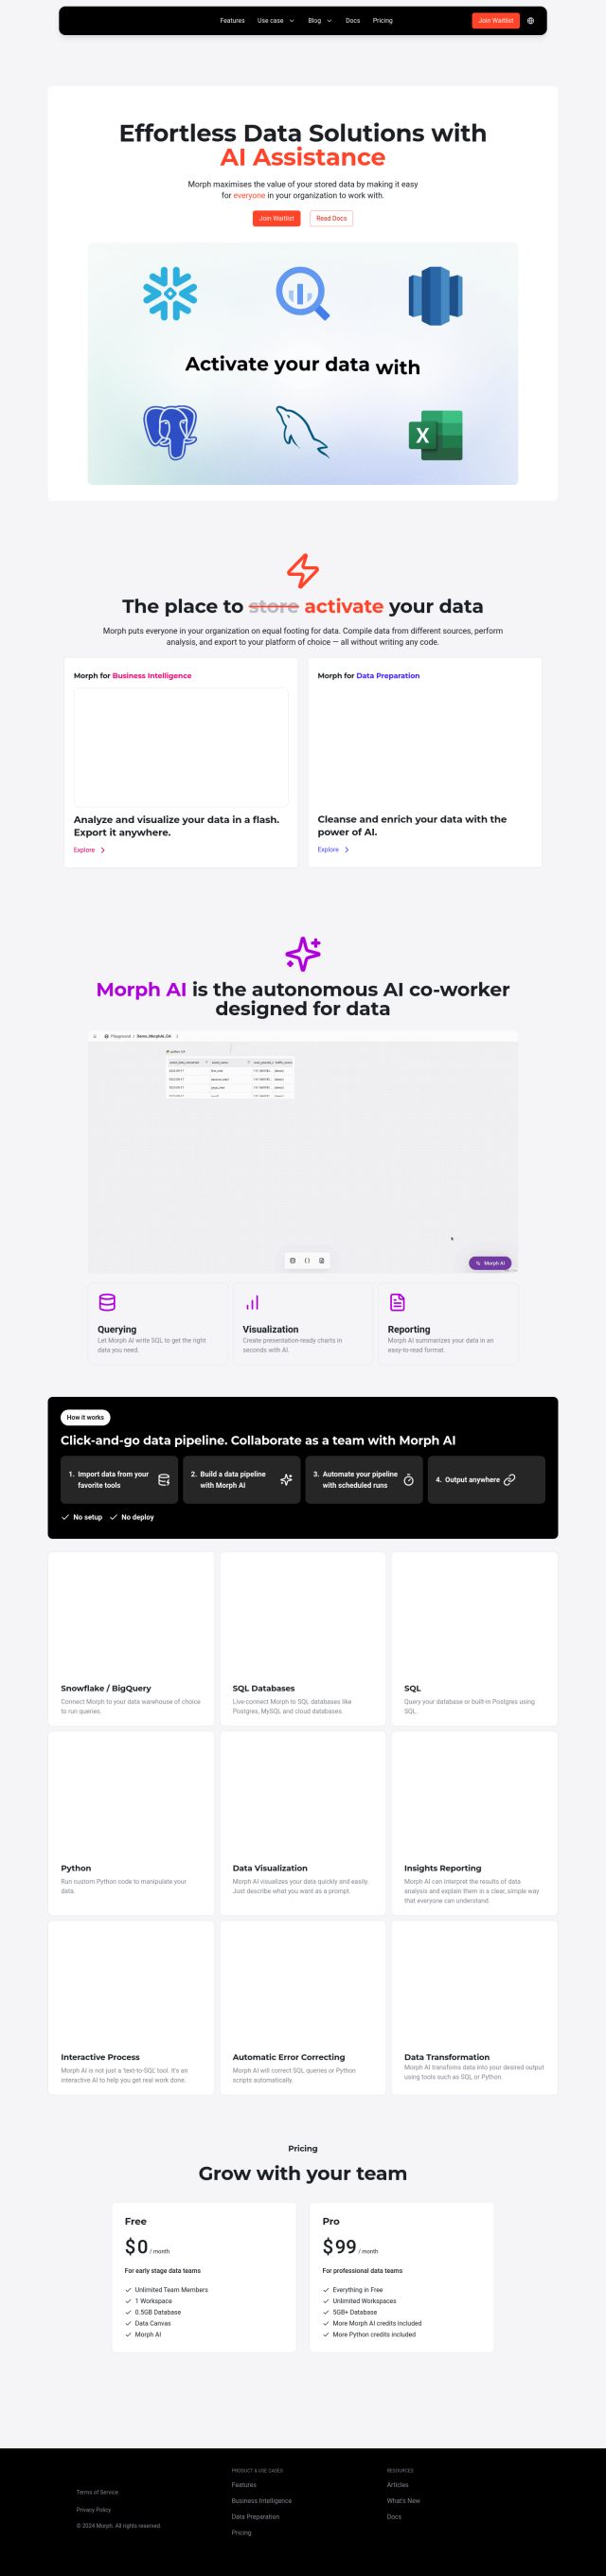
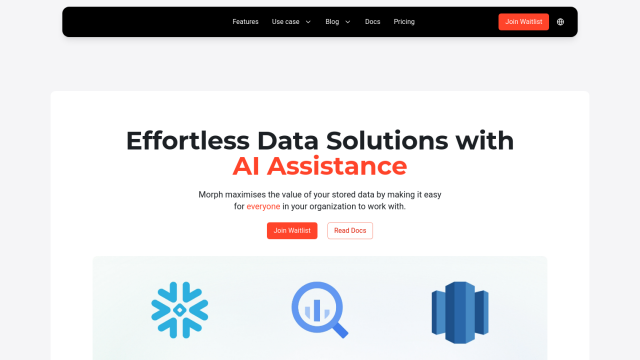
Morph screenshot thumbnail

Morph

Last, Morph is an AI-powered data assistant that makes data accessible and usable for all stakeholders. It ingests data from various sources, analyzes it and exports results without any coding. Morph handles data ingestion, visualization and reporting, and is good for people who need to quickly get data analysis up and running and automate more complex tasks.

Additional AI Projects

Onboard Email screenshot thumbnail

Onboard Email

Automatically segments customers, optimizes inbox placement, and composes personalized emails for every interaction, driving engagement and conversions.

Athena screenshot thumbnail

Athena

Accelerate analytics workflows with an AI-native platform that learns your workflow, automates tasks, and enables collaborative data analysis with natural language interaction.

Explo screenshot thumbnail

Explo

Embed interactive dashboards and self-serve reporting directly into products, enabling end-users to customize analytics experiences and make better decisions.

Chartonomics screenshot thumbnail

Chartonomics

Convert any data into 20+ chart types with a single click, no setup required, for instant visualization and communication of complex ideas.

Coginiti screenshot thumbnail

Coginiti

Enables teams to create, publish, and consume trusted data products, increasing productivity and speeding up delivery of actionable insights.

Avian screenshot thumbnail

Avian

Analyze complex data sets with natural language processing, extracting key metrics in seconds, without storing data, and ensuring real-time insights and compliance.

Airbyte screenshot thumbnail

Airbyte

Seamlessly integrate data from 300+ sources to destinations, with features like custom connector building, unstructured data extraction, and automated schema evolution.

Baresquare screenshot thumbnail

Baresquare

Detects anomalies 24/7, automates root cause analysis, and prioritizes actions based on business impact, empowering teams to take swift, data-driven decisions.

MOSTLY AI screenshot thumbnail

MOSTLY AI

Generate fully anonymous synthetic tabular data without programming, ensuring privacy compliance and confidential data sharing, with natural language querying and analysis.

DataGems screenshot thumbnail

DataGems

Uncover hidden insights in marketing data with AI-powered agents, automated updates, and customizable templates, empowering teams to make data-driven decisions.

Glide screenshot thumbnail

Glide

Build custom apps powered by AI without coding, integrating with existing data and deploying to any device with self-designing layouts.

Metaplane screenshot thumbnail

Metaplane

Automates end-to-end data observability, detecting anomalies and data quality issues in real-time, enabling data teams to resolve problems quickly and confidently.

Noodl screenshot thumbnail

Noodl

Build full-stack applications quickly with a visual development tool that integrates AI-generated building blocks, database queries, and UI elements for rapid iteration.

Slatebox screenshot thumbnail

Slatebox

Create editable visualizations from natural language prompts in real-time, fostering efficient team collaboration and diagram creation.

Estuary screenshot thumbnail

Estuary

Build and automate fast, reliable, and low-latency data pipelines with 100+ no-code connectors for real-time CDC, ETL, and streaming data integration.

FlowCharts.ai screenshot thumbnail

FlowCharts.ai

Build and send smart forms, surveys, and decision trees via SMS, email, and chatbots, with automated workflows and real-time data analysis.

Grafbase screenshot thumbnail

Grafbase

Unify data sources into a single graph, deploy anywhere, and enjoy advanced security, caching, and analytics for seamless GraphQL API development.

Imagica screenshot thumbnail

Imagica

Build AI-powered apps without coding, using a no-code interface that lets you define functions with plain language and integrate real-time data sources.

Xata screenshot thumbnail

Xata

Serverless Postgres environment with auto-scaling, zero-downtime schema migrations, and AI integration for vector embeddings and personalized experiences.

Storydoc screenshot thumbnail

Storydoc

Create interactive, engaging presentations that drive lead conversions and customer engagement with AI-generated decks, automatic slide design, and real-time analytics.