Question: Can you suggest a tool that turns complex data into engaging visualizations for non-technical stakeholders?

Tableau
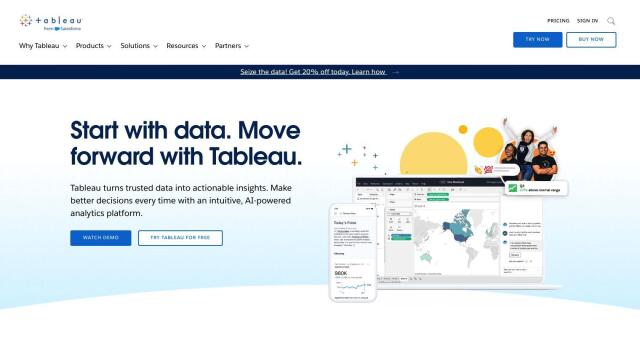
If you need a tool to convert raw data into interactive visualizations for non-technical audiences, Tableau is a top contender. This business intelligence and analytics software lets you create visualizations using a drag-and-drop interface and share the results. With features like AI/ML abilities, governance and collaboration tools, Tableau is geared to help you build a data culture that improves operations and delights customers.

Polymer
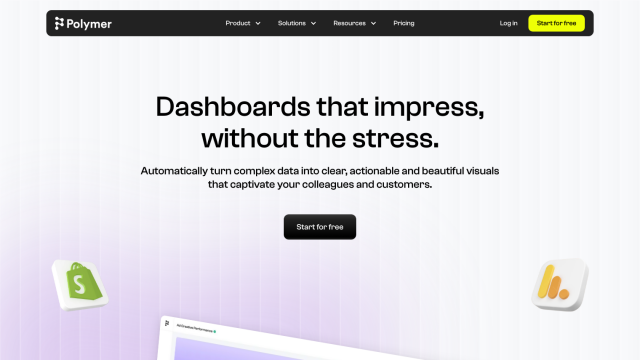
Another strong contender is Polymer, an AI-powered dashboard creation tool that can convert complex data into insights automatically. It can link multiple data sources and requires no data science or engineering skills to build your first dashboard in a few minutes. Polymer offers real-time insights, pre-built templates, easy sharing and customization, so a wide range of people can analyze and present data in a digestible form.

Onvo
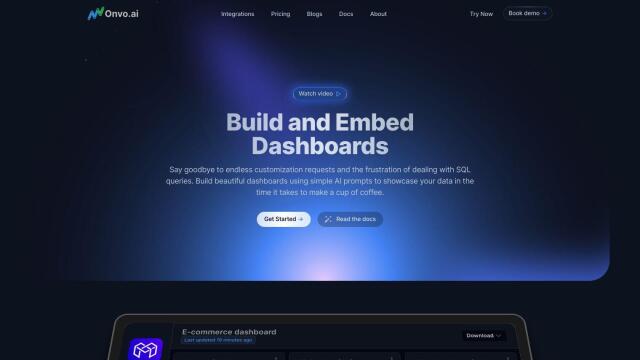
Onvo is another contender. This AI-powered data visualization tool lets you create interactive charts and insights without having to write complicated queries or fiddle with data. It connects to a variety of data sources, lets you customize for brand styling, and supports easy sharing and embedding. Onvo is good for startups and enterprises that want to simplify workflows and automate data visualization.


DataChat
If you like the no-code approach, DataChat is a generative AI platform that converts raw data into insights. Its spreadsheet and chat software interface lets you analyze data without having to write any code. DataChat automates data prep, exploration and modeling and offers AI-generated answers to questions you upload to the data, so it's good for both data scientists and business users.

