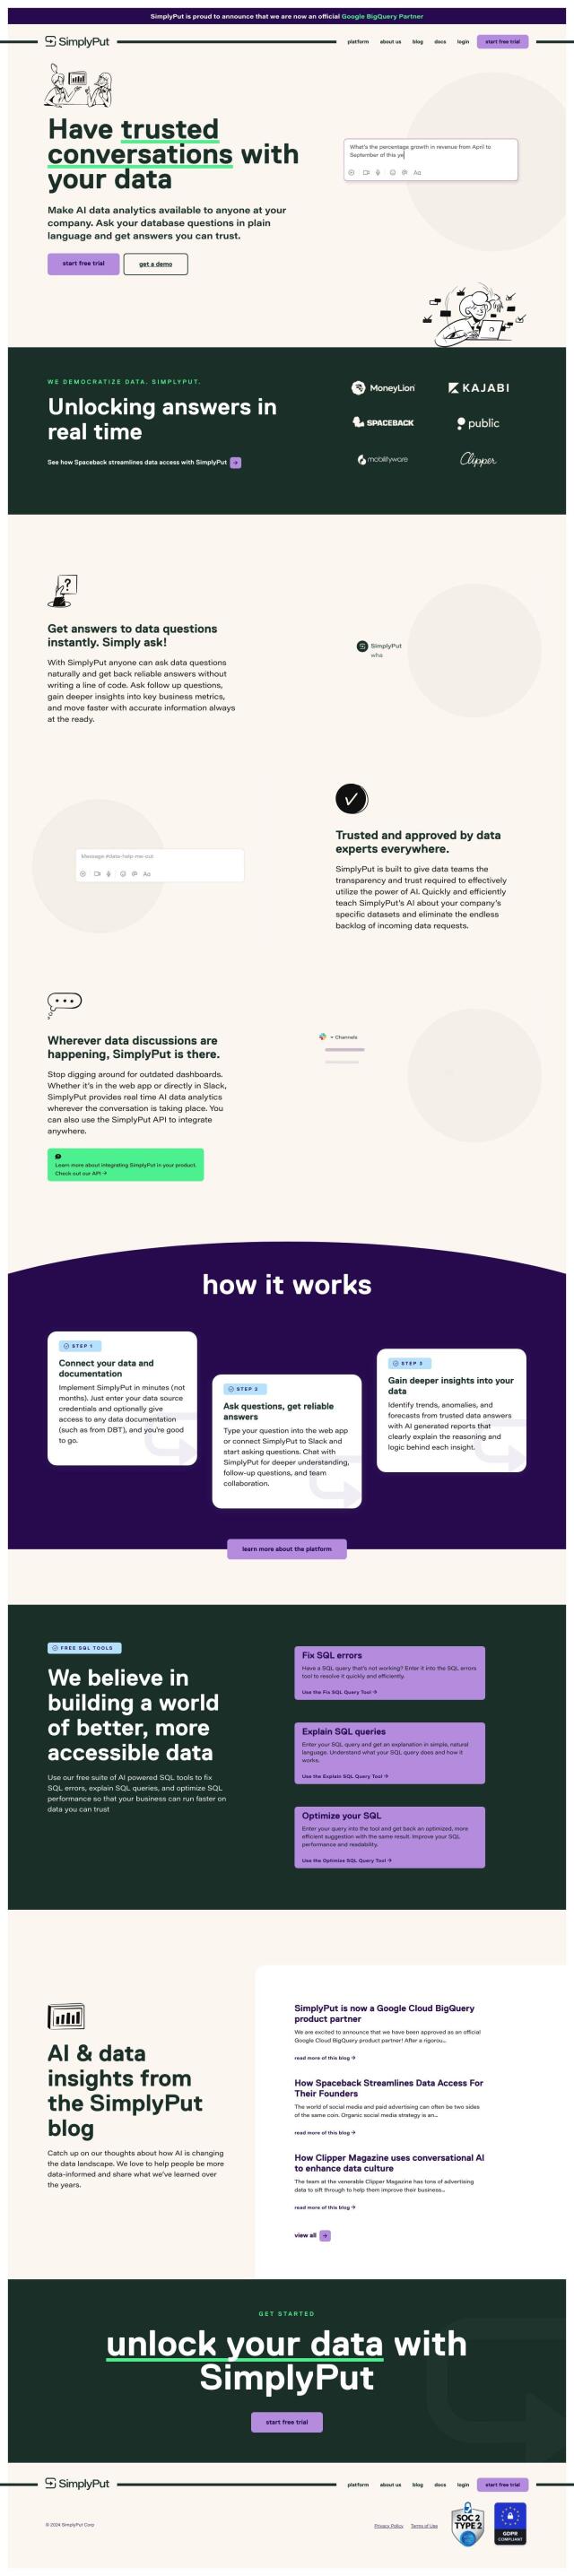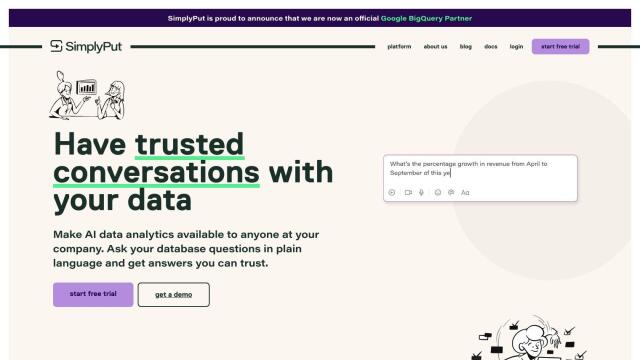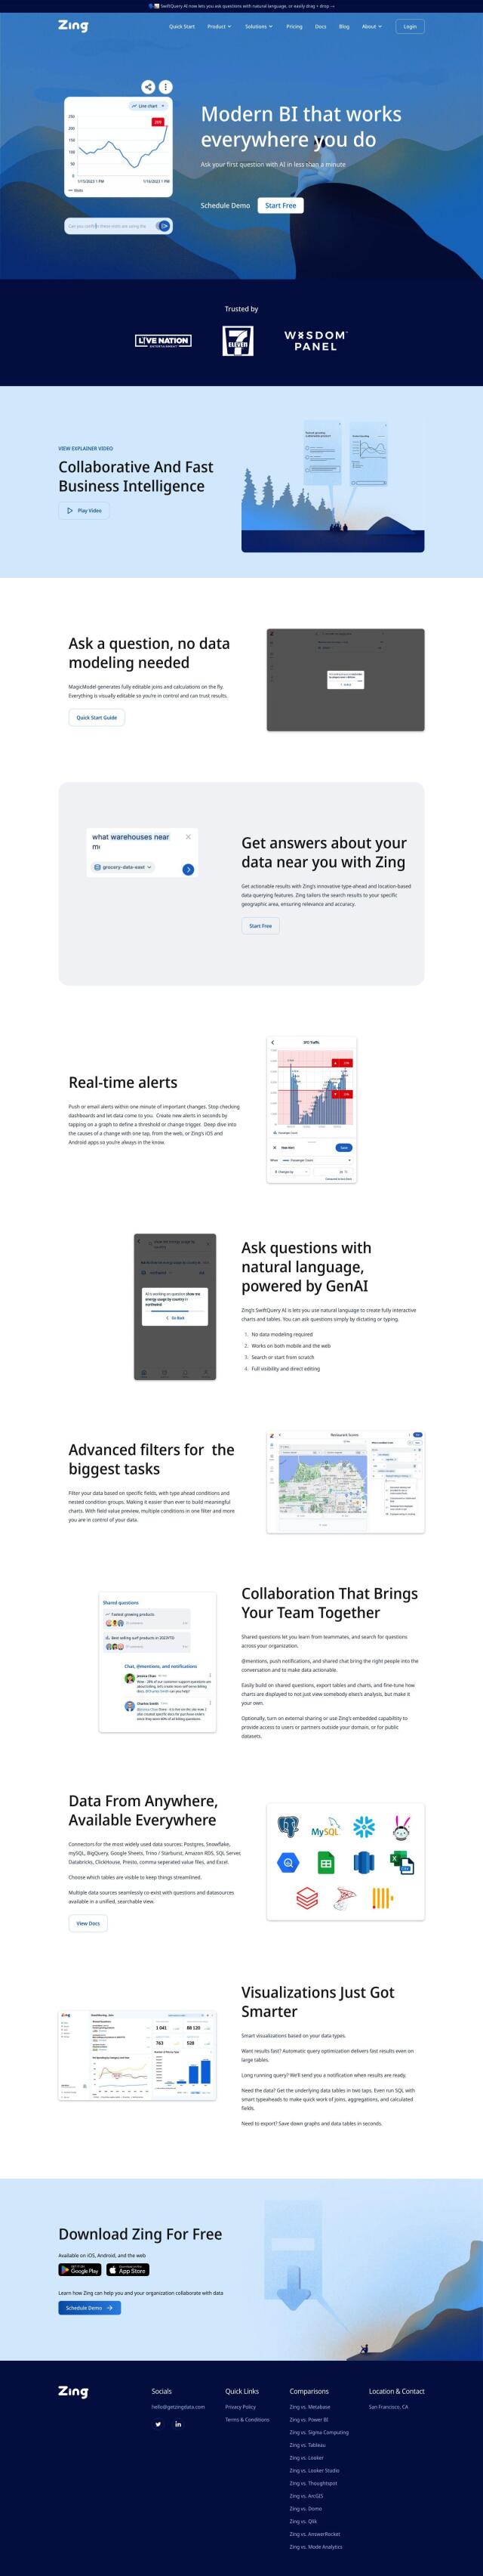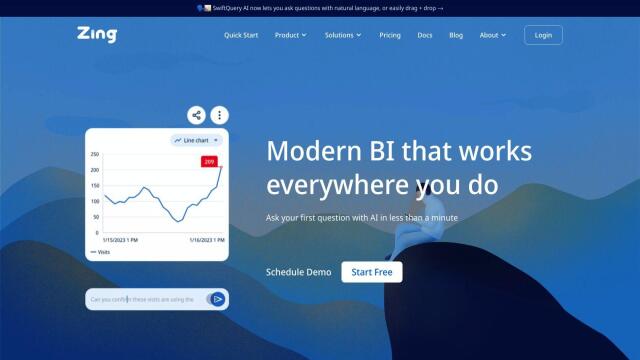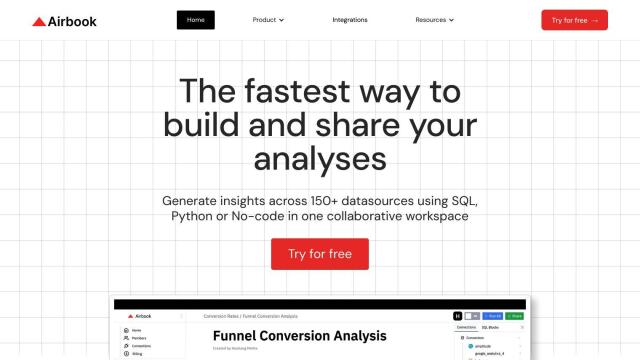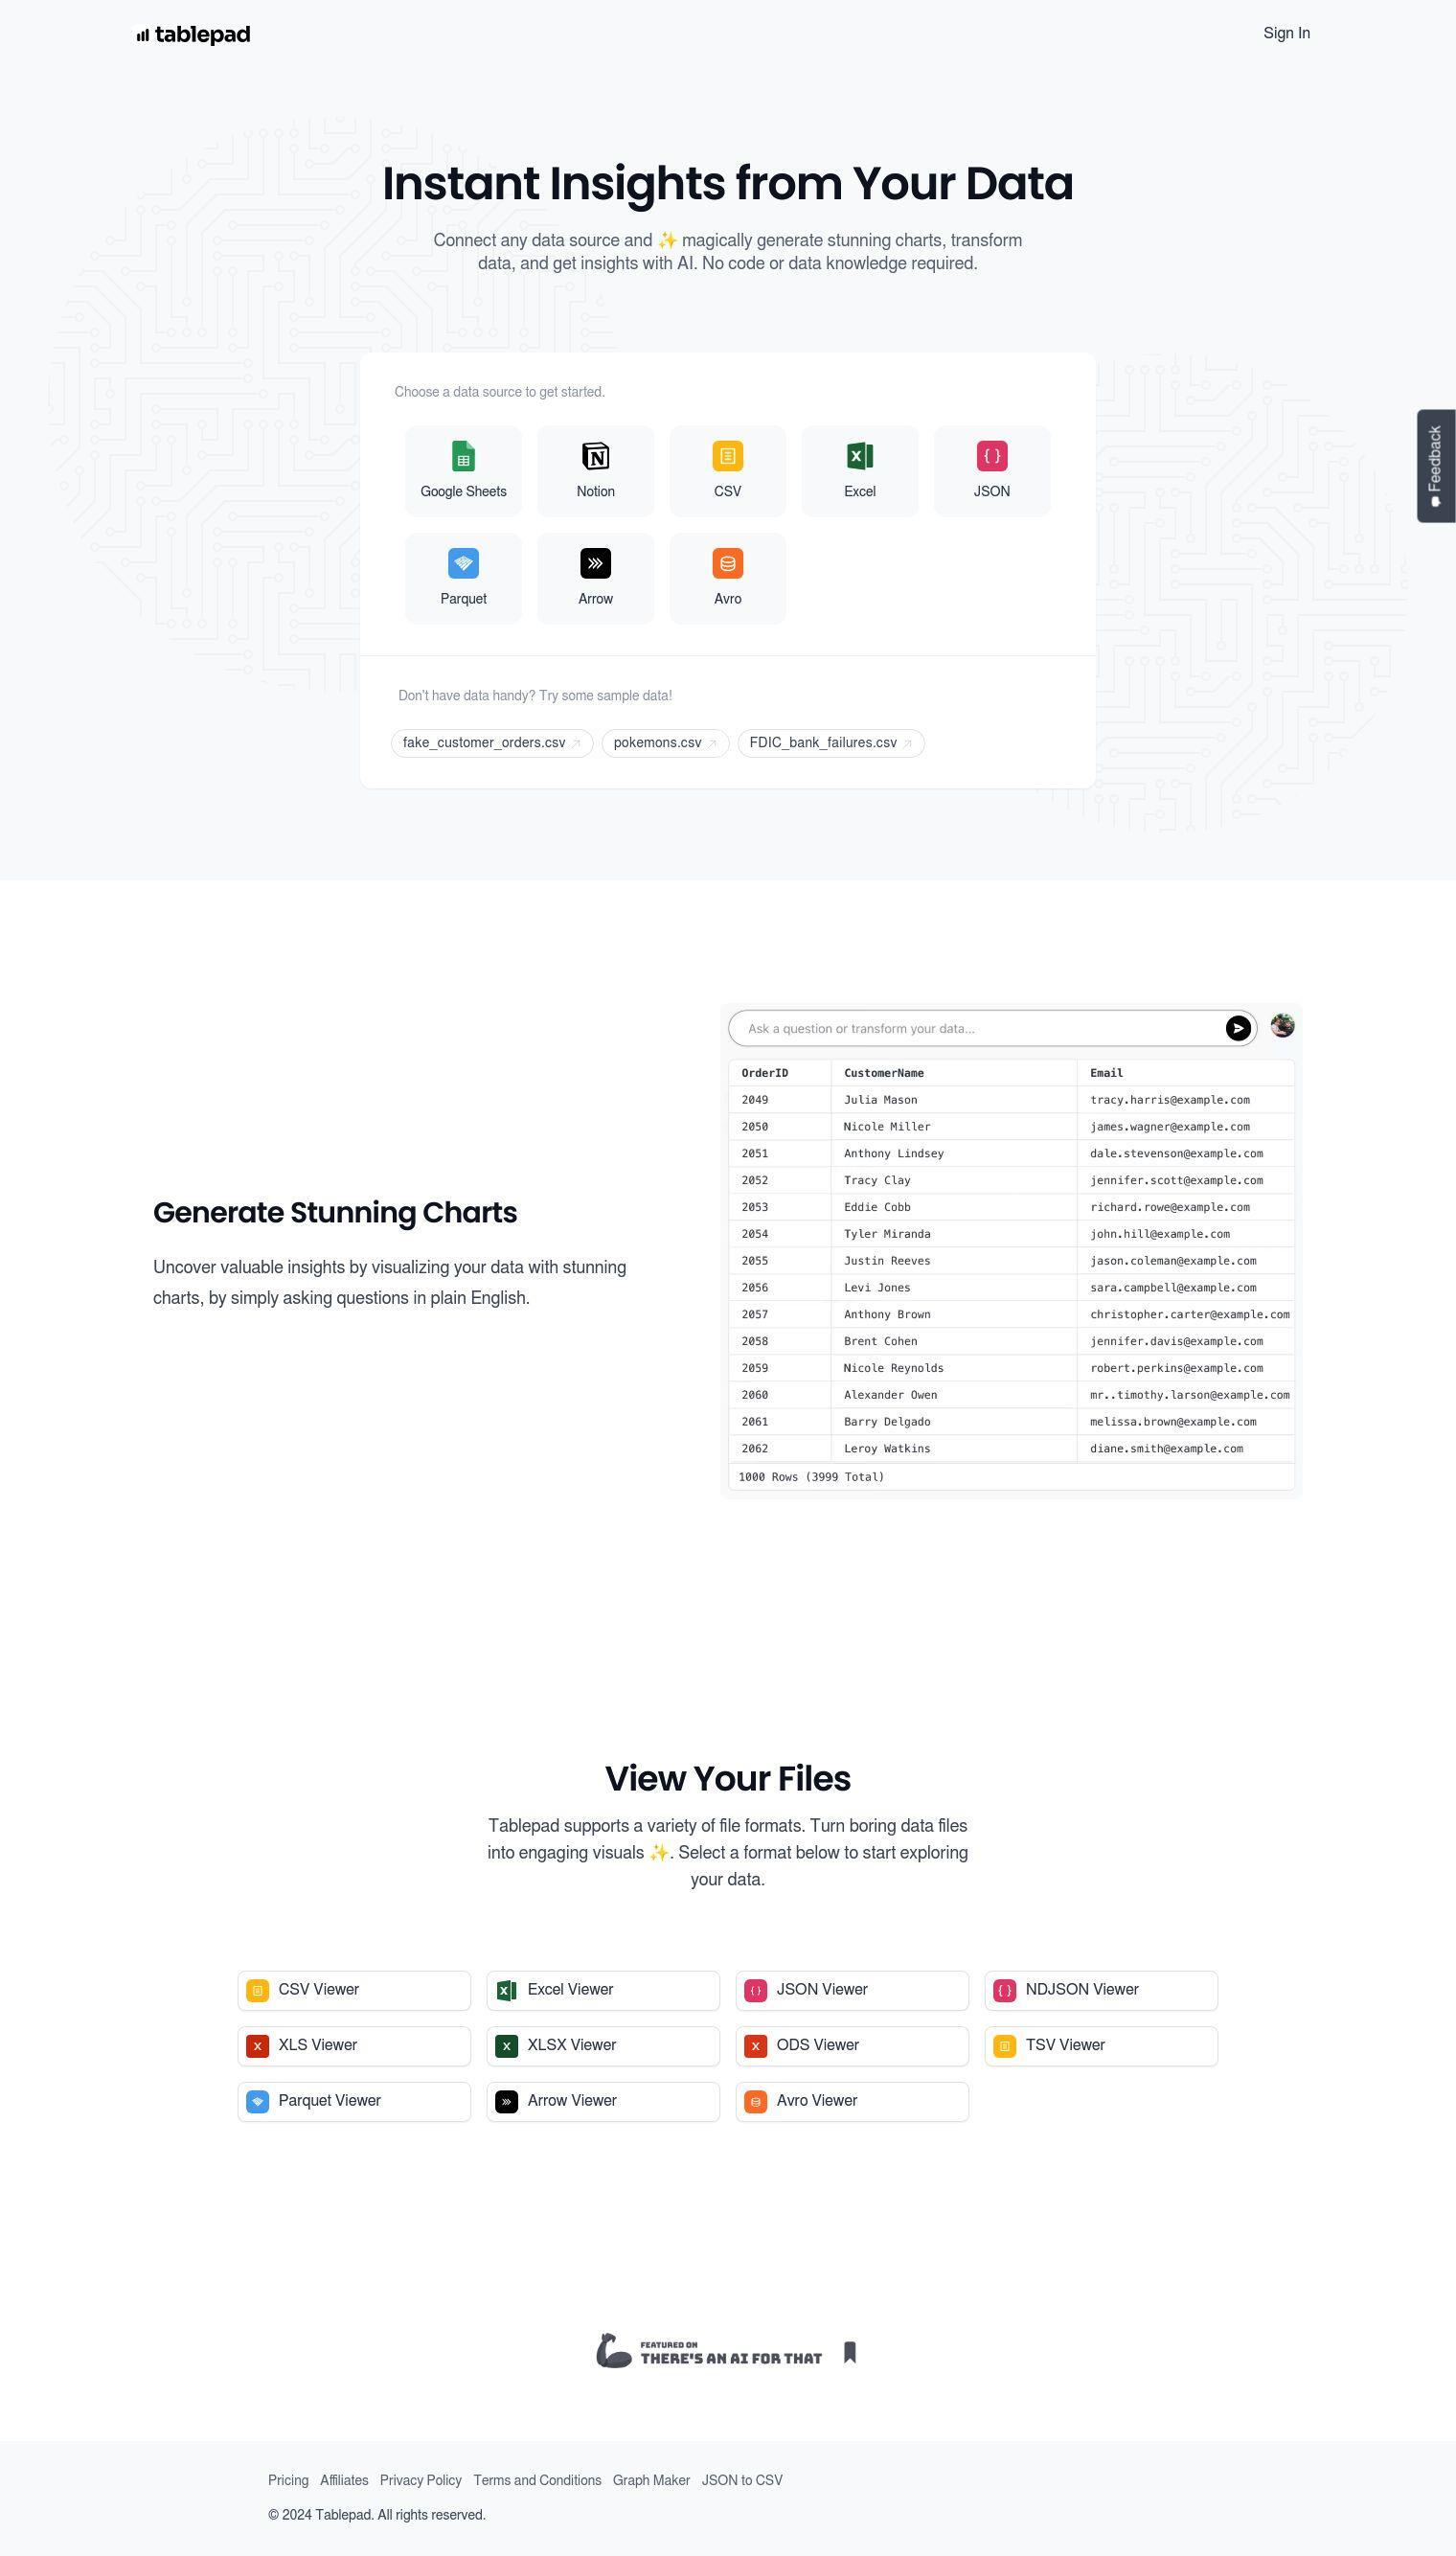
Tablepad is a data visualization tool that uses AI to create charts and insights from a variety of data sources without needing to write code or know anything about data. Users can link to data sources like Google Sheets, Notion, CSV, Excel, JSON and other formats, then ask plain English questions to instantly create charts.
Some of the key features of Tablepad include:
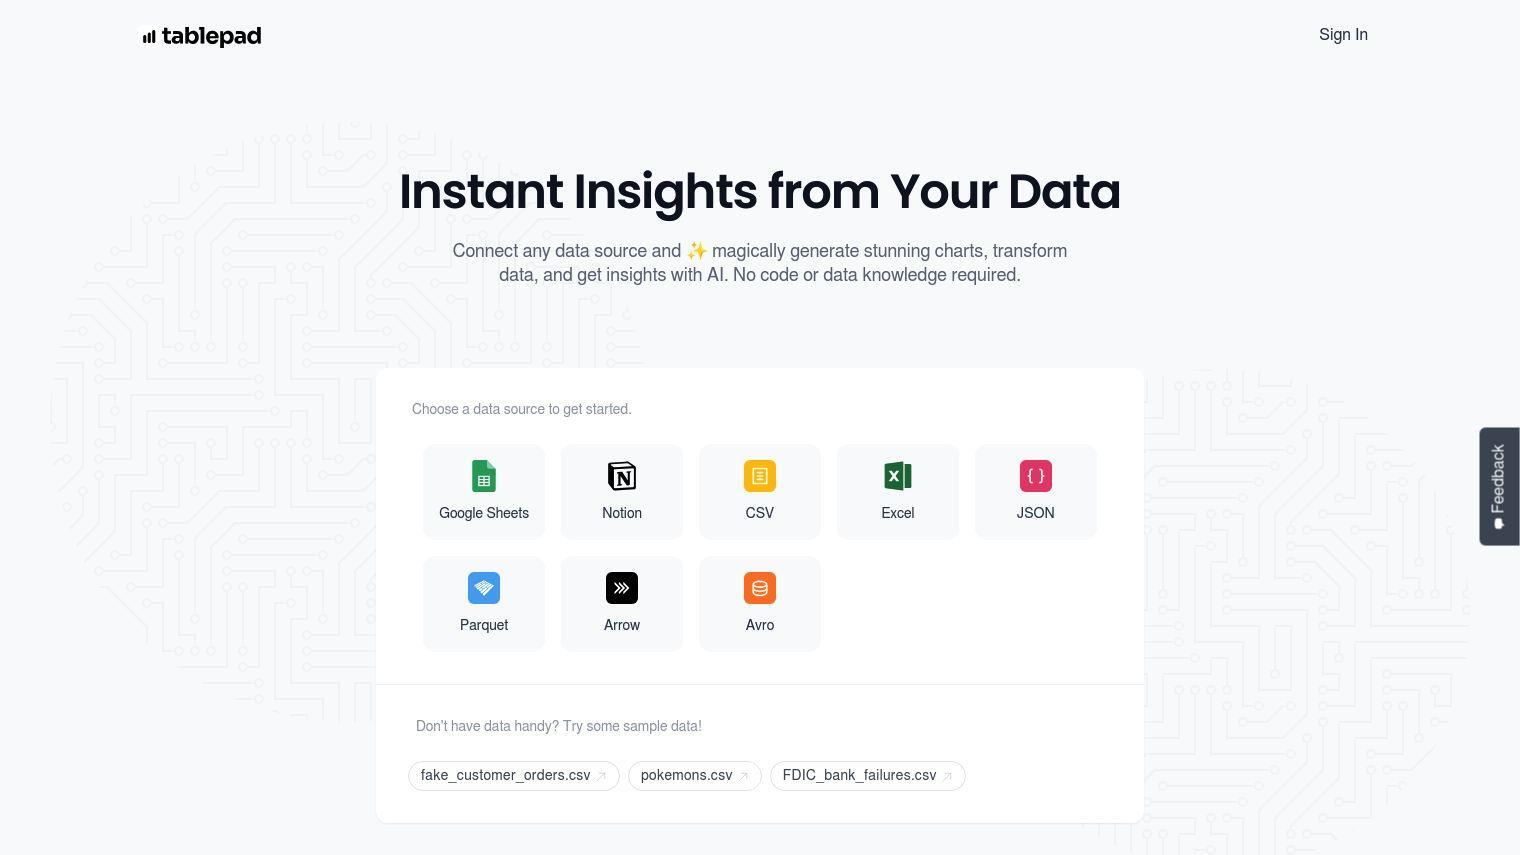
- Data Connection: Connects to a wide variety of data sources including Google Sheets, Notion, CSV, Excel, JSON, Parquet, Arrow, Avro, and more.
- Chart Generation: Offers a variety of chart types including Pie Charts, Bar Charts, Line Charts, and Scatter Plots.
- File Formats: Can export data in a variety of file formats for viewing, including CSV, Excel, JSON, NDJSON, XLS, XLSX, ODS, TSV, Parquet, Arrow, and Avro.
- Sample Data: Offers sample data sets for users without data.
Tablepad is used to help users gain insights by visualizing their data in a way that's easy to understand and engaging.
Pricing is straightforward and based on the number of credits used per month:
- Free: $0/month, 15 credits, one data source, 2MB data sources, and 7-day data retention.
- Pro: $19/month, 3,000 credits, 50 data sources, 1GB data sources, and forever data retention. One credit is one query, and credits don't carry over from month to month.
Tablepad is great for anyone who wants to get quick insights from their data without having to spend a lot of time writing code or learning about data. Its AI-powered graph maker lets you create professional-looking charts in a snap.
Published on June 14, 2024
Related Questions
Tool Suggestions
Analyzing Tablepad...