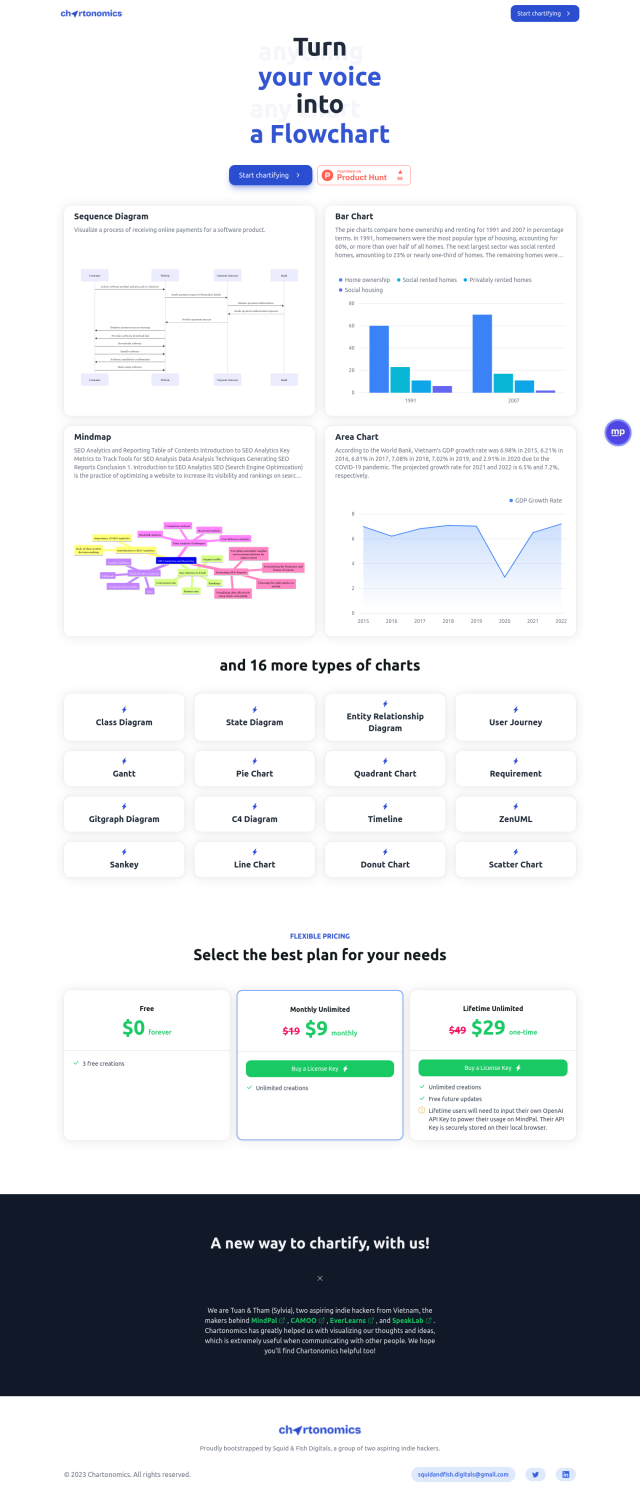
Question: Can you suggest a platform that automates data visualization and provides presentation-ready charts?

Tableau
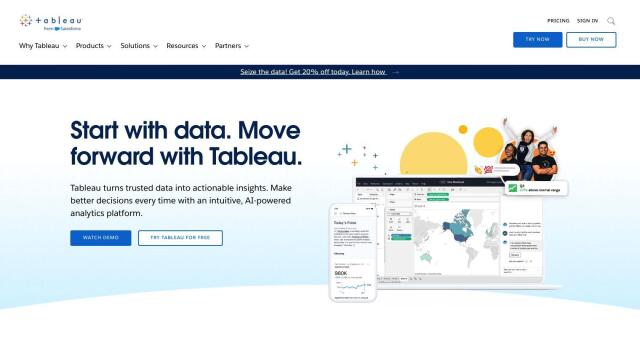
If you're looking for a platform to automate data visualization and create presentation-ready charts, Tableau is an excellent choice. It offers a comprehensive suite of tools that allow users to create visualizations through drag-and-drop interfaces and share them easily. With features like AI/ML capabilities, governance, and visual storytelling, Tableau is ideal for business intelligence and analytics needs. It includes various deployment options, including cloud and on-premises, and has been successfully used by companies like Whole Foods Market and Keybank.

Polymer
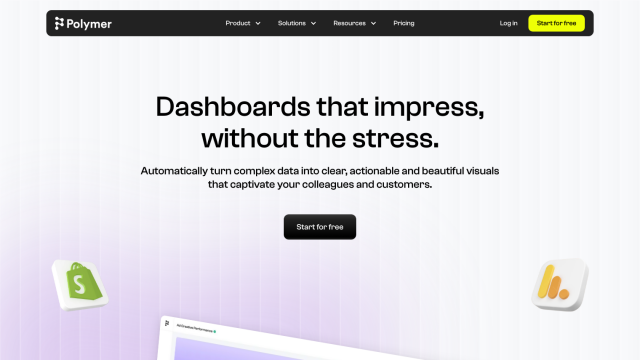
Another powerful option is Polymer, which converts complex data into actionable insights using AI. It integrates multiple data sources and builds dashboards quickly without requiring data science expertise. Key features include real-time updates, AI-driven insights, and personalized visualization. Polymer's extensive data connectors and customization options make it suitable for a wide range of users.

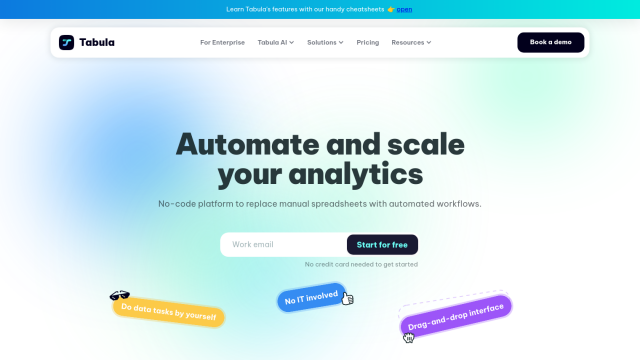
Tabula
For no-code solutions, Tabula offers a versatile platform that automates spreadsheets and workflows. It integrates with widely used data tools and provides features like automated workflows, custom metrics, and real-time insights. Tabula is designed for both technical and non-technical users and can be deployed as on-premise, cloud, or desktop apps.

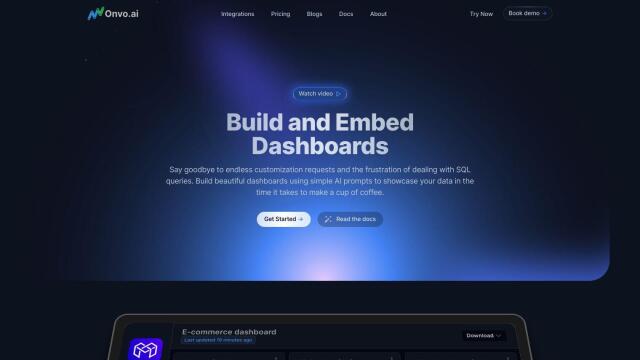
Onvo
Lastly, Onvo is another AI-powered data visualization platform that simplifies the process of creating interactive charts and insights. With support for various data sources and a focus on customization and ease of use, Onvo is suitable for both startups and enterprises looking to streamline their data visualization processes.

