Question: I'm looking for a solution that allows me to build custom reports with a drag-and-drop interface and access pre-built templates for common metrics.

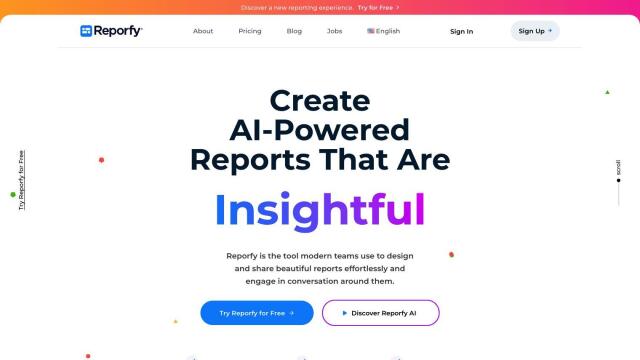
Reporfy screenshot thumbnail

Reporfy

If you're looking for a way to create custom reports with a drag-and-drop interface and tap into pre-built templates for common metrics, Reporfy could be a great option. Reporfy has a platform that automates reporting with AI, a drag-and-drop interface for creating custom reports, and pre-built templates for project and company management. It's geared for teams that want to automate reporting, track projects and make data-driven decisions.

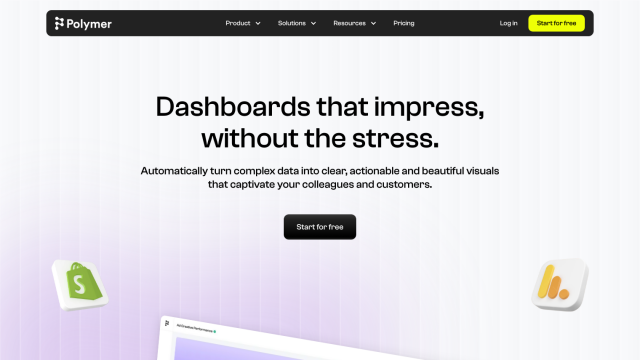
Polymer screenshot thumbnail

Polymer

Another top contender is Polymer, an AI-powered dashboard creation tool that turns complex data into insights. It's got more than 20 data connectors, and its automated dashboard updates mean you can get real-time insights. Polymer comes with pre-built templates for different use cases, and you can easily share and collaborate, so data analysis is accessible to a broader audience.

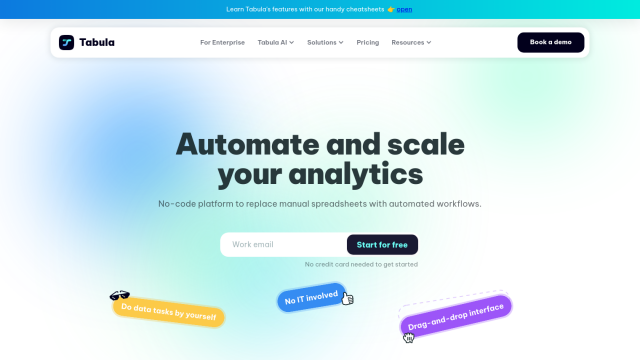
Tabula screenshot thumbnail

Tabula

If you prefer a no-code option, Tabula is worth a look. It can combine, transform and visualize data, automate workflows and integrate with data tools you're already using. Tabula offers custom metrics, reports and advanced filtering, so it can handle a variety of business needs. Its drag-and-drop interface and real-time feedback means you can get up and running fast without needing to know how to code.

Graphy screenshot thumbnail

Graphy

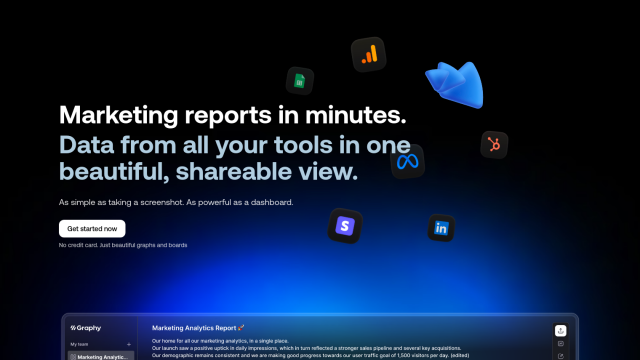
Last, Graphy lets you create interactive reports from different sources. It can import data with one click from tools like Google Sheets and Meta Ads, and you can customize visualizations with AI-powered productivity tools. Graphy is good for marketers and growth marketing managers who want to automate reporting and get stakeholders up to speed.

Additional AI Projects

Daydream screenshot thumbnail

Daydream

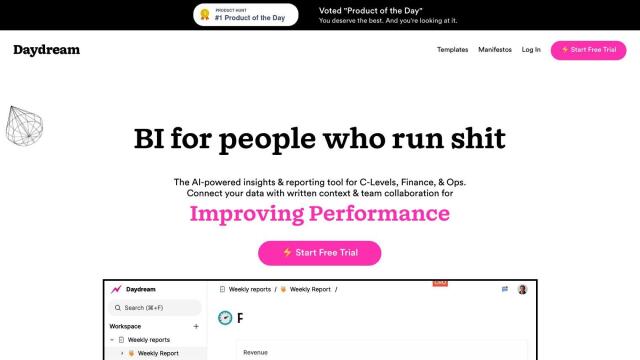
Unify data, context, and team collaboration to drive informed decisions, with AI-powered connections and expert-built templates for instant business insights.

Canvas screenshot thumbnail

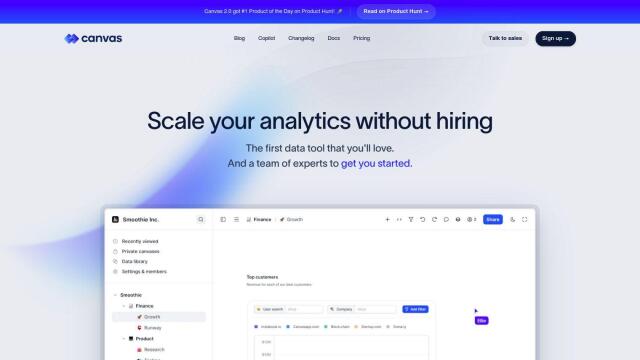
Canvas

Link, query, and visualize data from 150+ SaaS tools without coding, empowering non-technical teams to make data-informed decisions.

Spreadsheet.com screenshot thumbnail

Spreadsheet.com

Combines spreadsheet interface with automation, customizable views, and integrations to streamline project management, data tracking, and team collaboration.

Airtable screenshot thumbnail

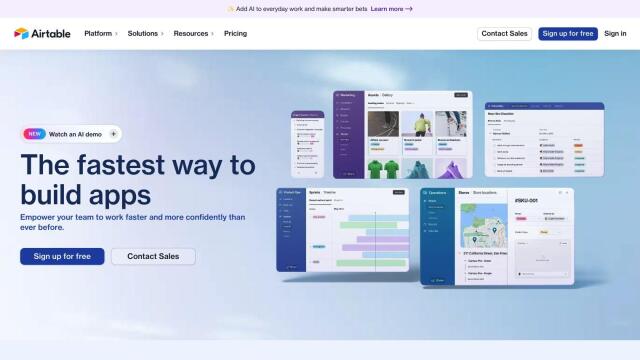
Airtable

Operationalize data and redesign workflows with AI-driven automation, custom interfaces, and real-time data visualization, all without extensive coding.

DataSquirrel screenshot thumbnail

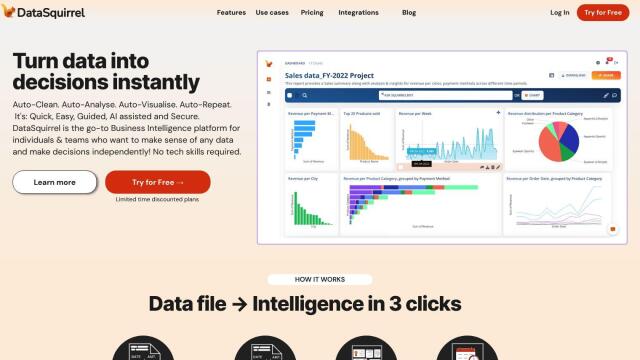
DataSquirrel

Upload, clean, analyze, and visualize data with a few clicks, automating tasks to gain fast insights and make data-driven decisions independently.

DataGems screenshot thumbnail

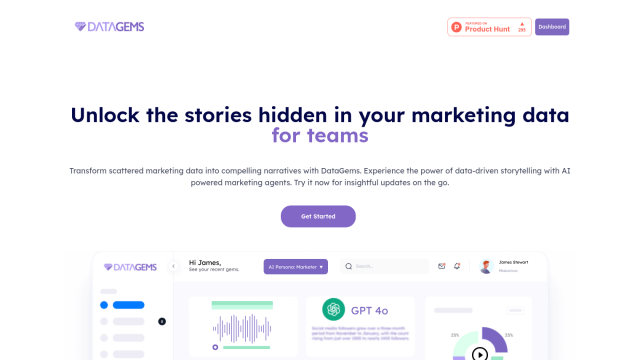
DataGems

Uncover hidden insights in marketing data with AI-powered agents, automated updates, and customizable templates, empowering teams to make data-driven decisions.

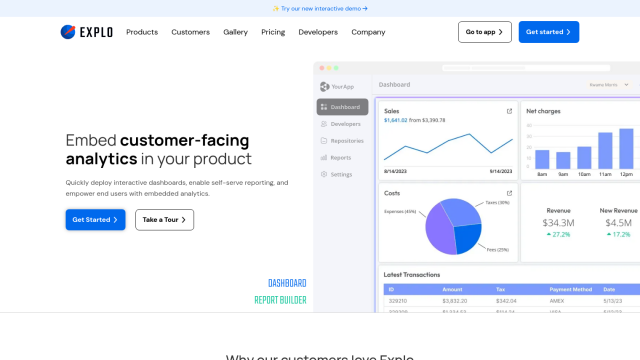
Explo screenshot thumbnail

Explo

Embed interactive dashboards and self-serve reporting directly into products, enabling end-users to customize analytics experiences and make better decisions.

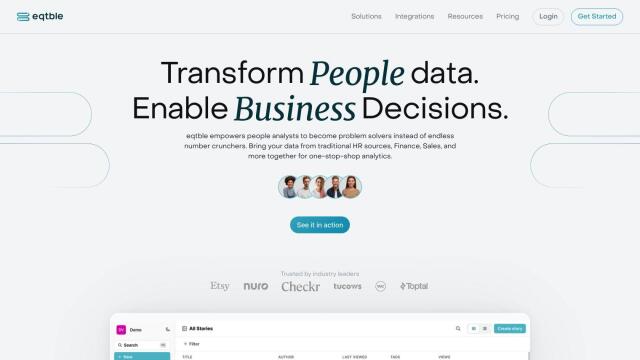
eqtble screenshot thumbnail

eqtble

Centralizes people data from various sources, enabling analysts to create data-driven stories and collaborate with others to drive informed decision-making.

Vizzly screenshot thumbnail

Vizzly

Build and share interactive, customizable analytics experiences with a no-code dashboard builder, empowering users to explore data without technical hassle.

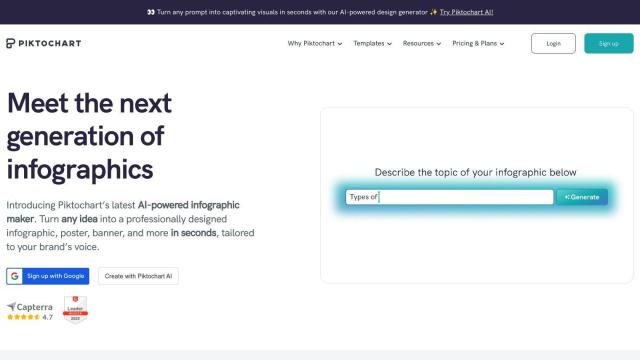
Piktochart screenshot thumbnail

Piktochart

Create professional-looking designs without design skills, leveraging a drag-and-drop editor, data visualization, and customization options to produce engaging visual content.

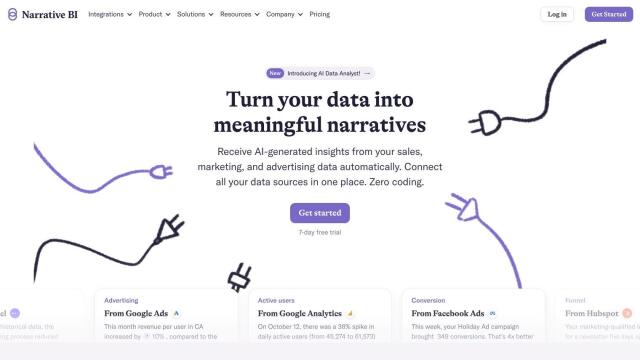
Narrative BI screenshot thumbnail

Narrative BI

Automatically generates personalized data narratives and alerts in plain language, transforming complex data into actionable insights for growth teams.

Softr screenshot thumbnail

Softr

Build custom client portals, internal tools, and community hubs without coding, using pre-built blocks and connecting to various data sources.

Onvo screenshot thumbnail

Onvo

Create interactive charts and insights with simple AI prompts, eliminating the need for complex queries and customizations.

Monitr screenshot thumbnail

Monitr

Unify data from multiple sources, create customizable charts and dashboards, and collaborate with team members using SQL queries and AI-driven analytics tools.

Hurree screenshot thumbnail

Hurree

Get instant insights without being a data expert, with one-click connections, centralized visualization, and AI-powered analysis transforming hours into clicks.

ClientReports screenshot thumbnail

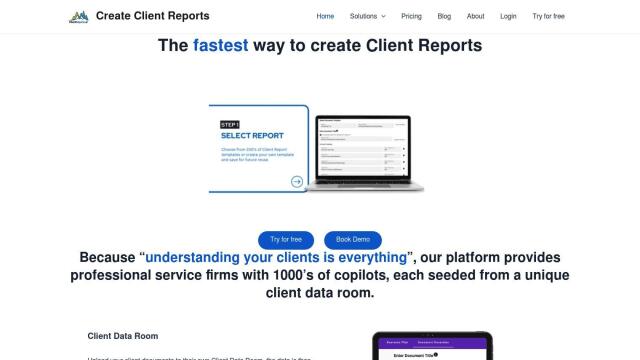
ClientReports

Automatically generate professional client reports with ease, streamlining the process with a 3-shot approach to headers, content, and fine-tuning.

Glide screenshot thumbnail

Glide

Build custom apps powered by AI without coding, integrating with existing data and deploying to any device with self-designing layouts.

B2Metric screenshot thumbnail

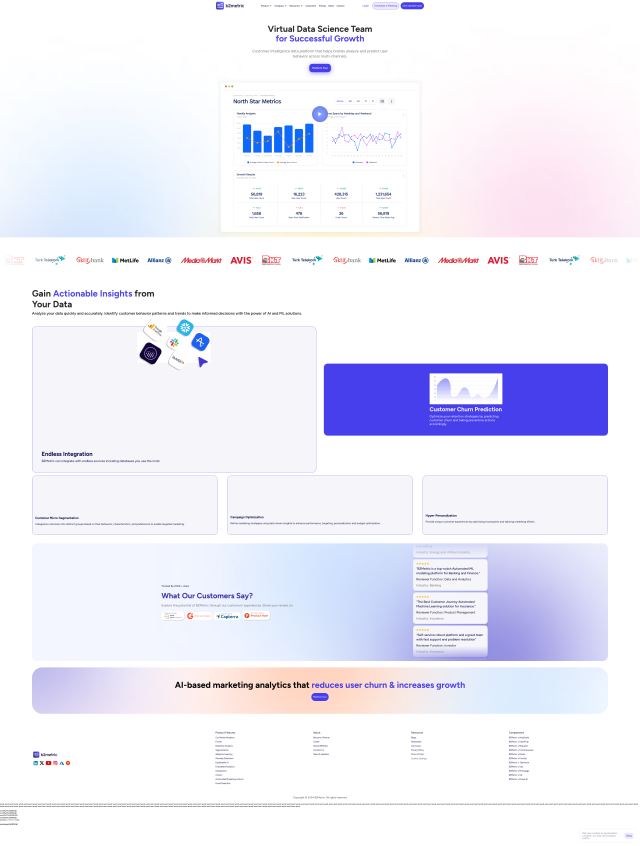
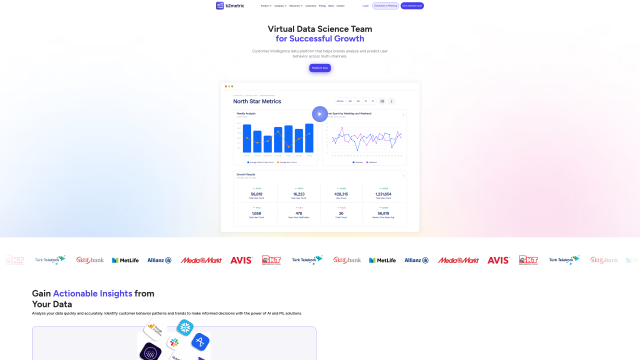
B2Metric

Unlock actionable insights with AI-driven data analytics, integrating multiple sources, and predicting customer churn, behavior, and preferences for optimized marketing and retention.

Databar screenshot thumbnail

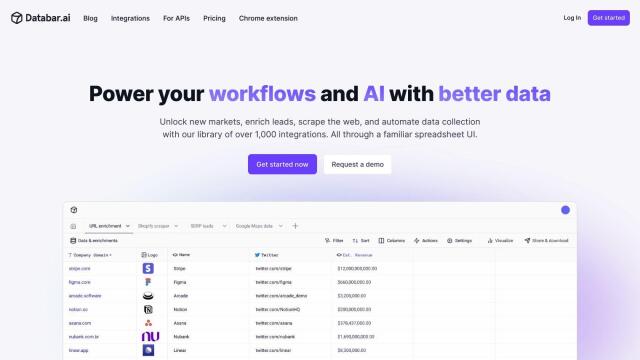
Databar

Connect to 1,000+ APIs without coding, automate workflows, and enrich data in real-time to power business operations across various industries.

User.com screenshot thumbnail

User.com

Automates marketing processes, turning user behavior into personalized experiences across channels, without requiring development work.