Question: I need a solution that provides custom layouts for data analysis and supports multiple file formats, including MCAP.

Foxglove screenshot thumbnail

Foxglove

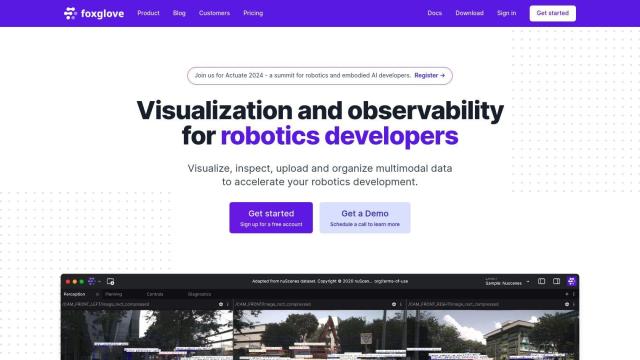
If you're looking for a tool that lets you create custom layouts for data analysis and that supports multiple file formats, including MCAP, Foxglove is another top contender. Foxglove is a multimodal data visualization and organization platform that's designed to speed up robotics development. It has rich, interactive visualizations for exploring live or recorded data from a variety of robotics software systems, including ROS 1 and ROS 2, and supports multiple file formats, including MCAP. The platform includes a variety of panels for inspecting data, including 3D, diagnostics, image, plot, publish, raw messages and state transitions. Foxglove lets you create custom layouts to speed up data analysis and interact with 3D robot models, visualize URDF models and connect to ROS robots with Rosbridge.

GoodData screenshot thumbnail

GoodData

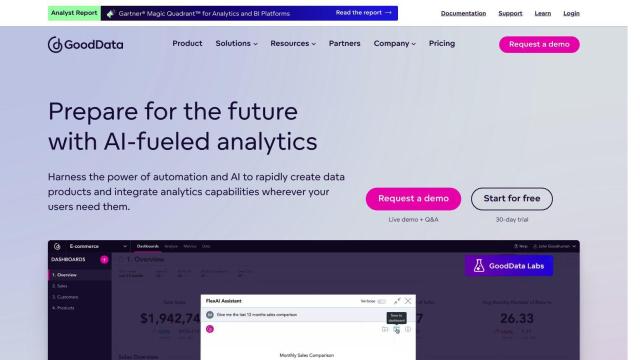
Another strong contender is GoodData, a data analytics platform that uses AI to let customers rapidly build customized data products with interactive analytics features. It has a no-code user interface, an AI Chat Assistant and the ability to embed it in cloud or on-premises environments. GoodData supports interactive dashboards and charts, embeds analytics into various workflows, and automates workflows for data analysts and engineers. The platform is geared for analytics engineers, data analysts and consumers, and offers a 30-day free trial with custom pricing available on request.

Mode screenshot thumbnail

Mode

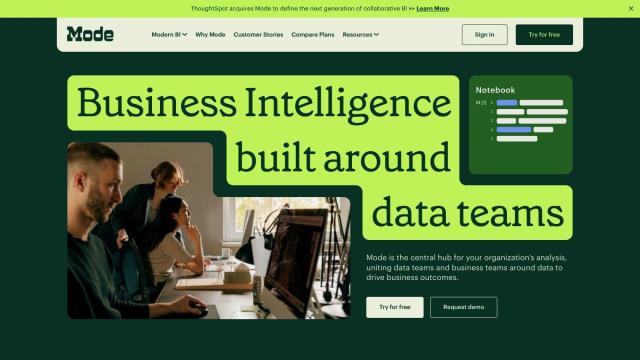
If you prefer a more collaborative approach to data analysis, you might want to check out Mode. Mode is a collaborative data platform that marries SQL, R, Python and visual analytics so you can easily connect to data, analyze it and share results. It supports ad hoc analysis, advanced analytics, interactive dashboards, self-service reporting and custom data apps. Mode is geared for both data teams and business teams, so it's adaptable for people who don't have a lot of technical expertise. It offers three pricing plans to accommodate different users: Studio (free), Pro and Enterprise.

Decipad screenshot thumbnail

Decipad

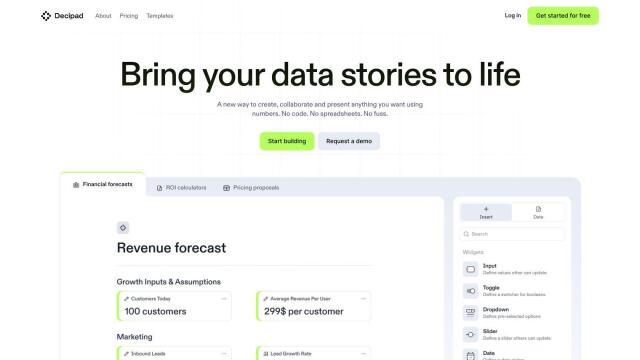
Another contender is Decipad, which combines the power of documents and spreadsheets into a unified data narrative. It supports interactive models, direct connections to many data sources and automatically updating plans, models and reports. Decipad offers collaboration tools, pre-built templates and no-code interfaces that make data analysis and presentation more accessible to a broader audience. It offers flexible pricing tiers, including a free plan, so it can be used by a variety of people.

Additional AI Projects

Tabula screenshot thumbnail

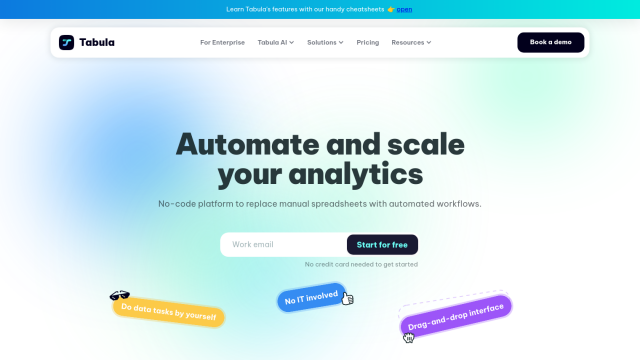
Tabula

Automate data workflows, standardize disparate sources, and gain real-time insights without coding, empowering data-driven decision-making across departments.

Dash screenshot thumbnail

Dash

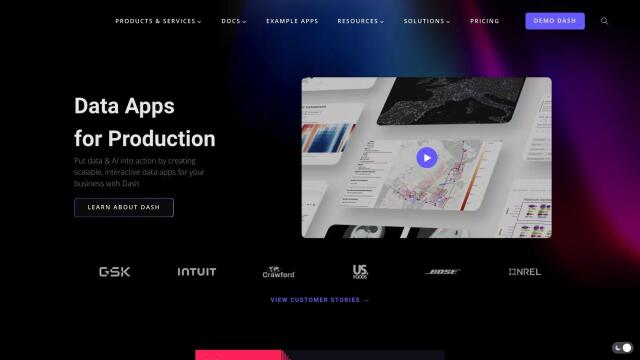
Build interactive, data-driven applications with Python, deploying and sharing with a single click, and scaling on any cloud infrastructure.

Polymer screenshot thumbnail

Polymer

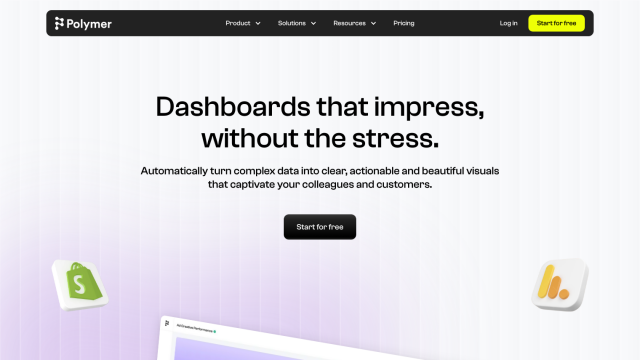
Converts complex data into intuitive, actionable visualizations, linking multiple sources and generating real-time insights with AI-driven analytics and suggested trends.

Explo screenshot thumbnail

Explo

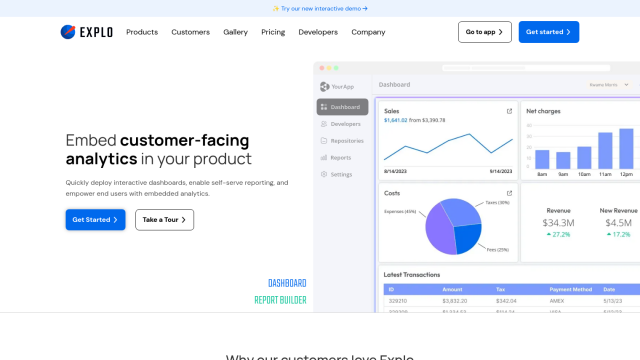
Embed interactive dashboards and self-serve reporting directly into products, enabling end-users to customize analytics experiences and make better decisions.

Canvas screenshot thumbnail

Canvas

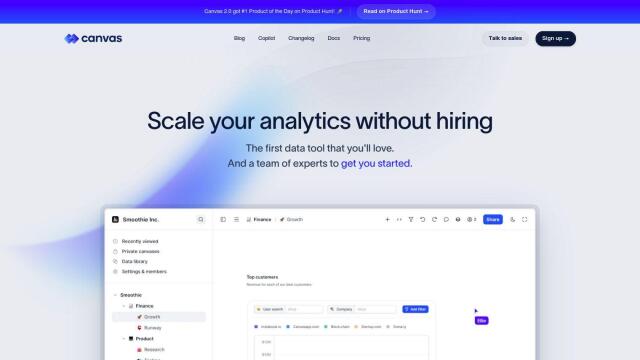
Link, query, and visualize data from 150+ SaaS tools without coding, empowering non-technical teams to make data-informed decisions.

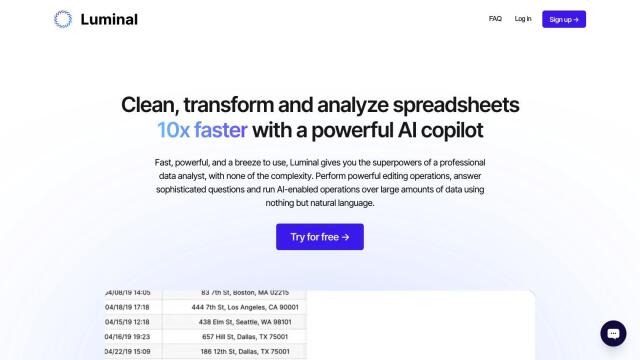
Luminal screenshot thumbnail

Luminal

Automate complex spreadsheet tasks up to 10 times faster with AI-driven cleaning, transformation, and analysis, using natural language prompts.

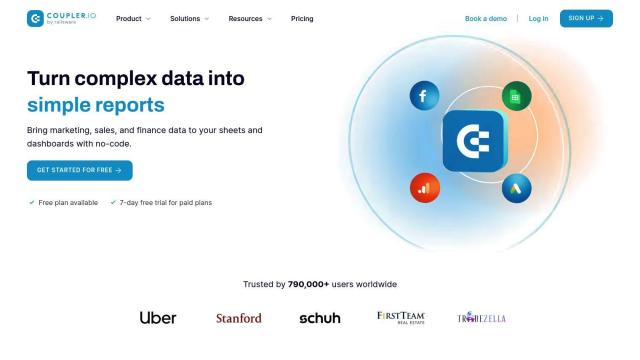
Coupler.io screenshot thumbnail

Coupler.io

Easily gather, visualize, and automate data from 200+ integrations with a drag-and-drop interface, empowering data-driven decisions without requiring coding expertise.

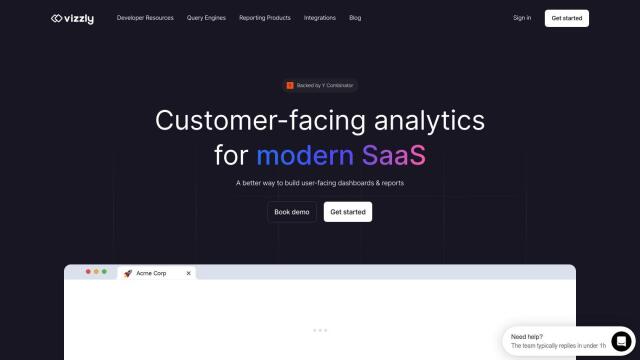
Vizzly screenshot thumbnail

Vizzly

Build and share interactive, customizable analytics experiences with a no-code dashboard builder, empowering users to explore data without technical hassle.

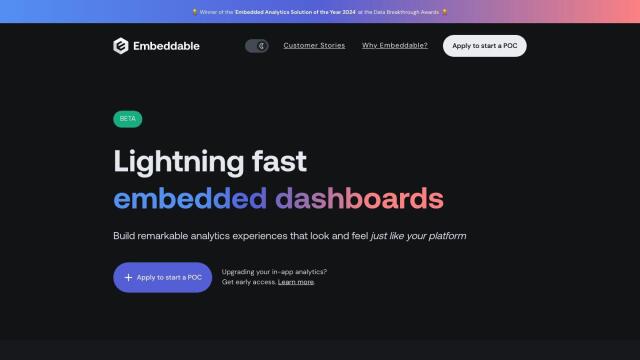
Embeddable screenshot thumbnail

Embeddable

Craft compelling customer-facing analytics experiences and embed them directly into your application, with full control and flexibility, in a fraction of the time.
Onvo screenshot thumbnail

Onvo

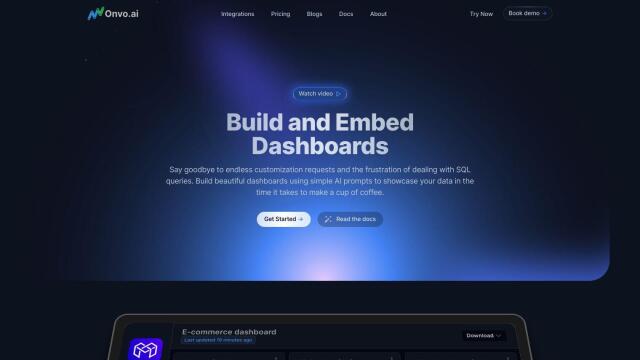
Create interactive charts and insights with simple AI prompts, eliminating the need for complex queries and customizations.
ChatDOC screenshot thumbnail

ChatDOC

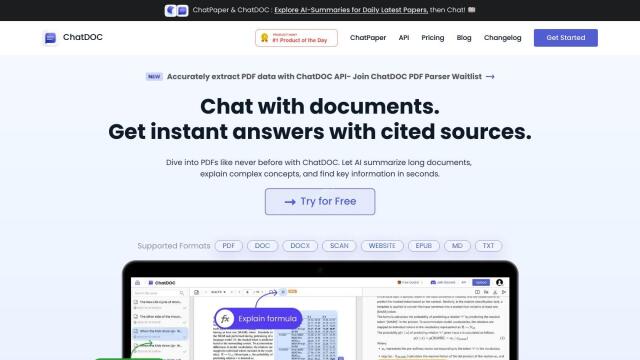
Get instant answers to questions about your documents, with AI-powered analysis and citation-backed results, across multiple file types and formats.

Latitude screenshot thumbnail

Latitude

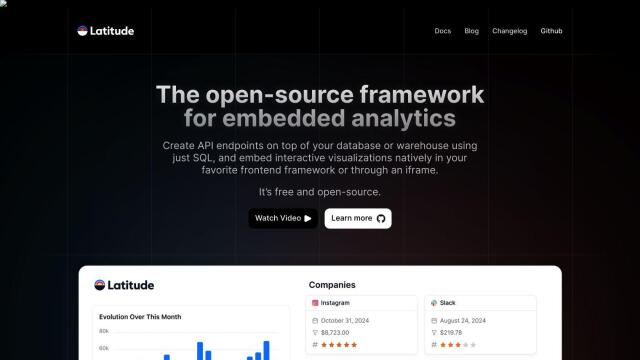
Automatically generate API endpoints from SQL queries, deploy scalable analytics, and embed interactive visualizations with a lightweight, modular framework.

ChatCSV screenshot thumbnail

ChatCSV

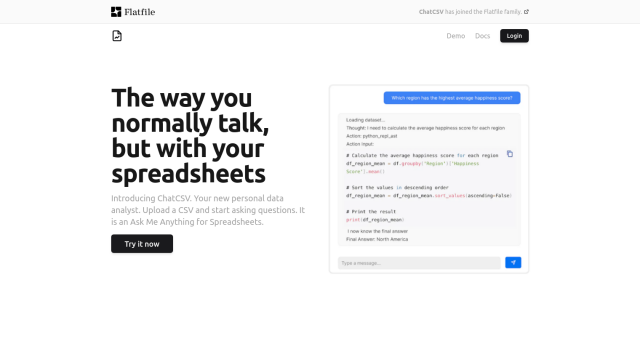
Ask plain language questions about your CSV data and receive chart answers, with automated starting points and conversation history for easy analysis.

ChartFast screenshot thumbnail

ChartFast

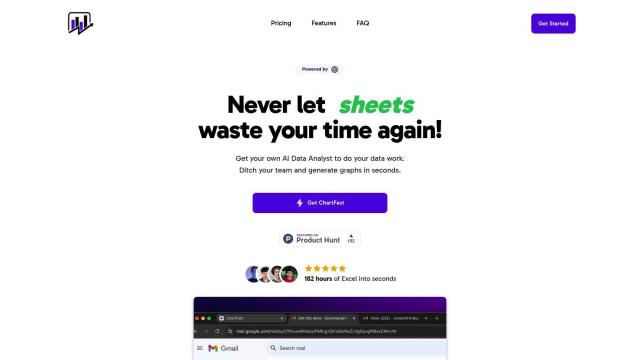
Automates data visualization and analysis, creating detailed graphs in seconds, while handling common data problems like missing values and outliers.

Label Studio screenshot thumbnail

Label Studio

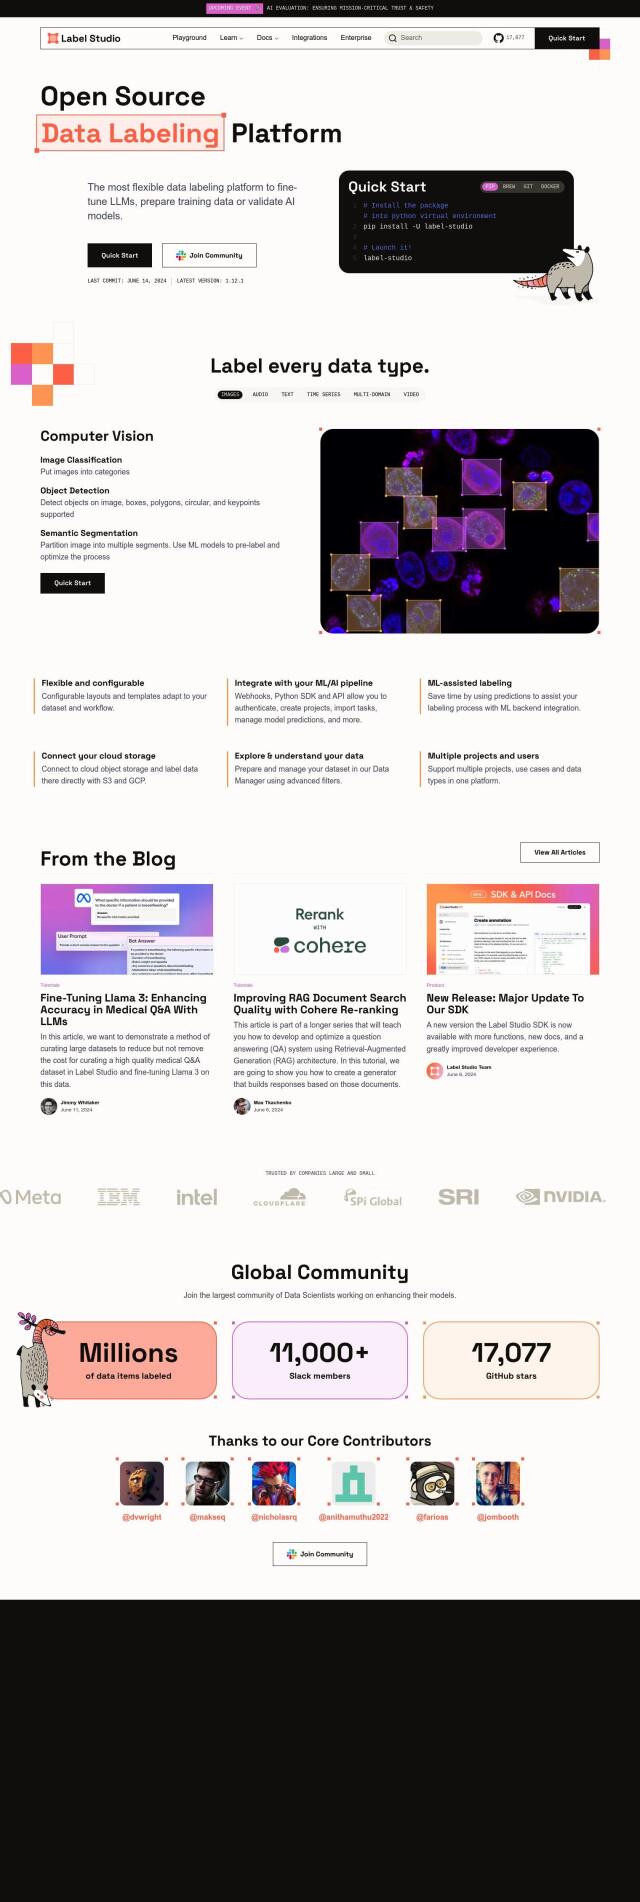
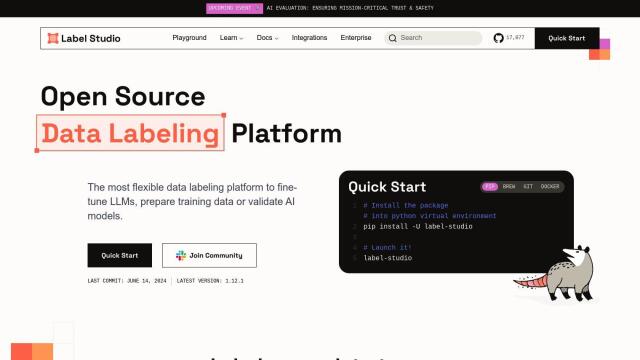
Flexible data labeling tool for various data types, including images, audio, and text, with customizable layouts, ML-assisted labeling, and cloud storage integration.

Columns screenshot thumbnail

Columns

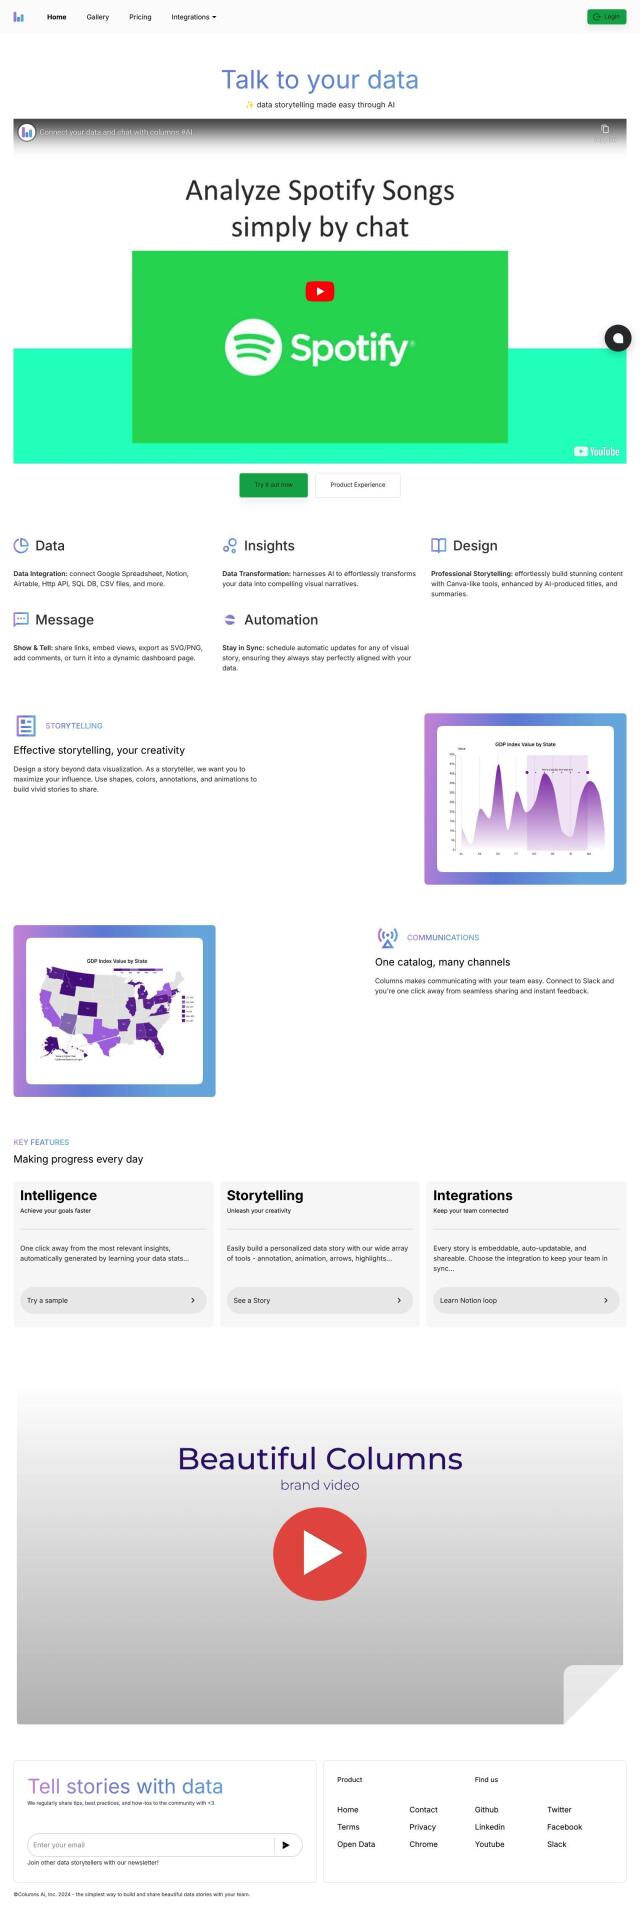
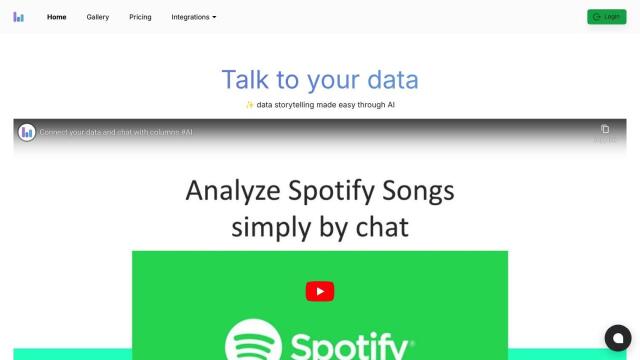
Collaborate on data visualization projects, manage data catalogs, and create compelling stories with AI-assisted insights, all in one self-service platform.

Patterns screenshot thumbnail

Patterns

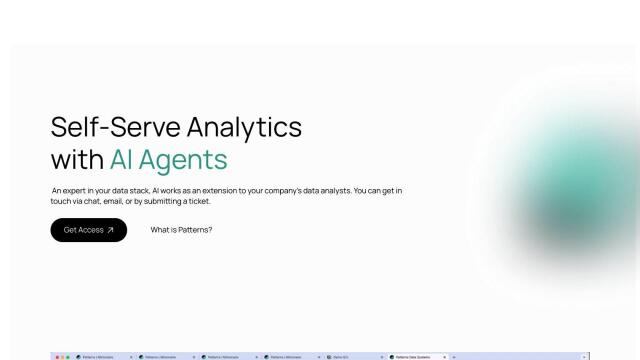
Ask a question, get an answer in seconds, without manual data analysis, using AI-powered SQL, charts, and explanations.

Coda screenshot thumbnail

Coda

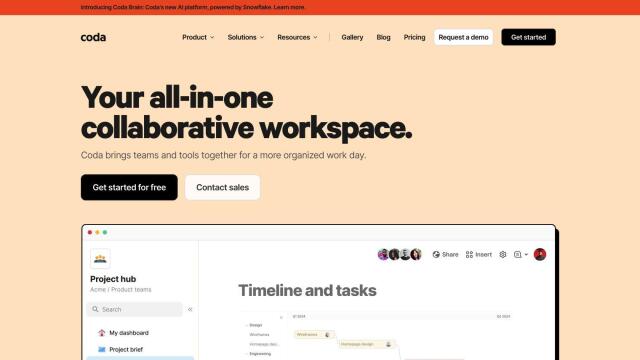
Combines documents, spreadsheets, and apps with AI-powered features like chat, assistant, and column automation to streamline collaboration and workflow.

MarkovML screenshot thumbnail

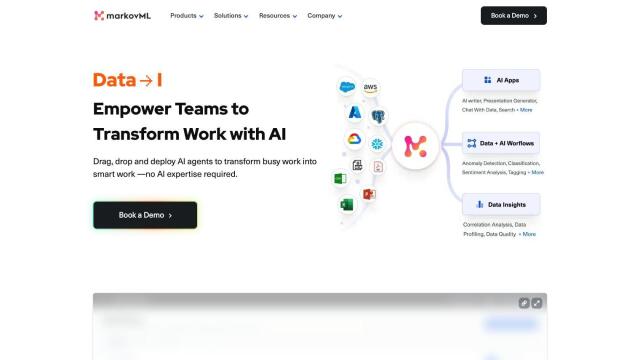
MarkovML

Transform work with AI-powered workflows and apps, built and deployed without coding, to unlock instant data insights and automate tasks.

Chimera screenshot thumbnail

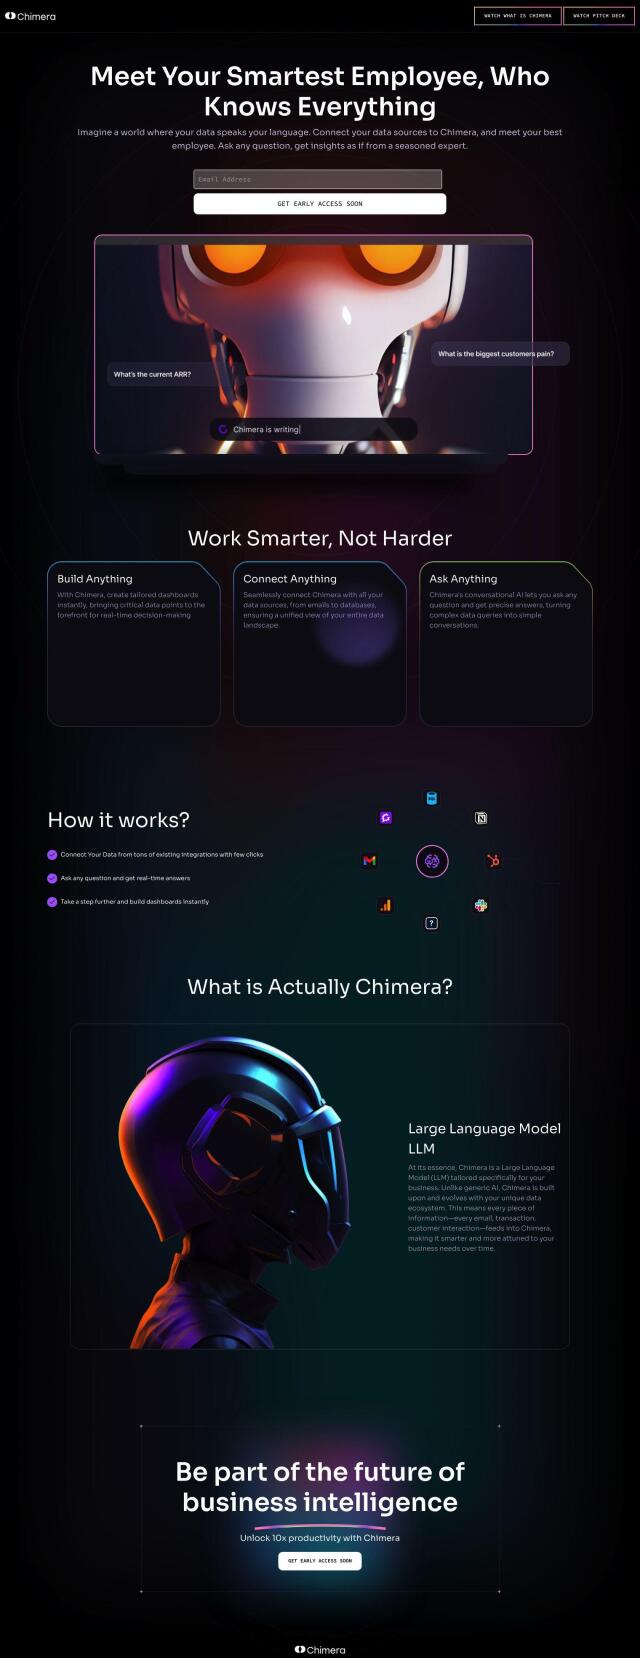
Chimera

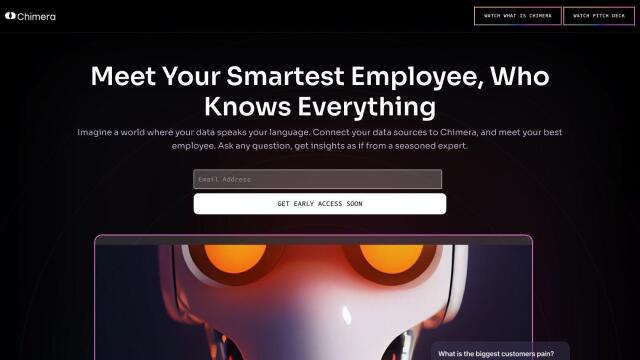
Integrates disparate data sources, providing real-time answers to complex queries and customizable dashboards for informed decision-making.