Question: Can you recommend a solution that allows me to create custom, interactive analytics dashboards and embed them directly into my application?

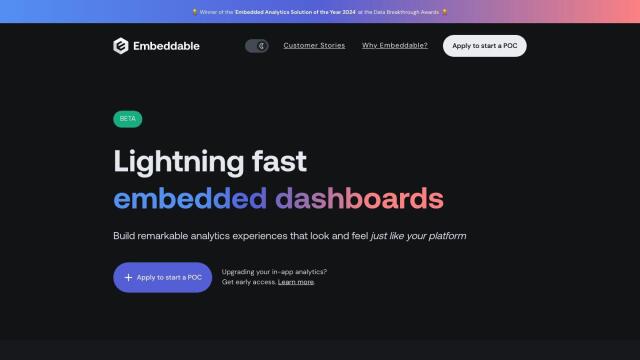
Embeddable
If you need a way to build your own, interactive analytics dashboards and then embed them directly into your application, Embeddable is a good option. This library lets you build and embed interactive customer-facing analytics experiences with React.js components that fit right into your existing design systems and CSS frameworks. It connects to a range of databases, including Snowflake, Databricks and BigQuery, and has features like server-side generated security tokens, customizable caching layers and support for libraries like ChartJS, D3 and Highcharts.

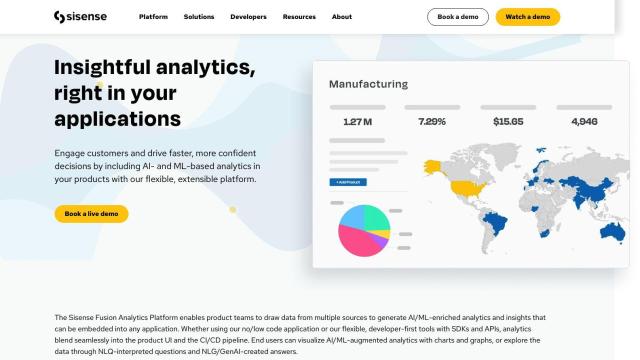
Sisense
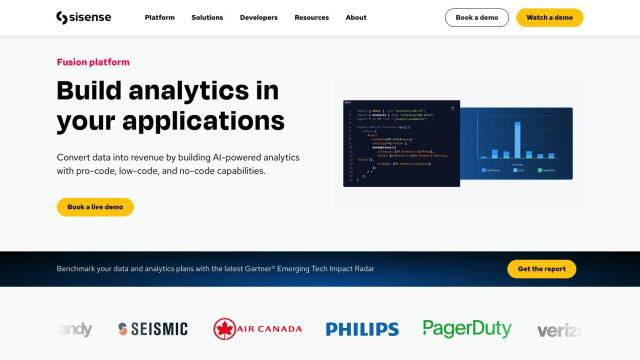
Another option is Sisense, which lets you add AI-infused analytics to your products and apps. It's got tools for pro-code, low-code and no-code environments so it should work for developers with varying levels of expertise. With tight integration, data connections to many sources and end-to-end security governance, Sisense lets you create custom dashboards and share insights through many channels.

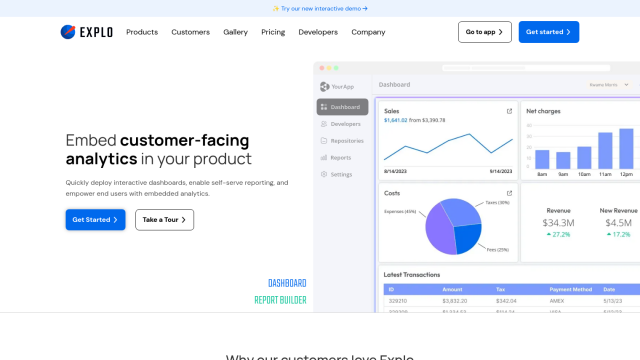
Explo
If you want something more embedded, Explo is a platform where you can embed interactive dashboards and self-serve reporting directly into your apps. It connects to many relational databases and data warehouses, lets you customize analytics experiences and has enterprise-grade security. Explo is good for a broad range of use cases, including SaaS platforms, e-commerce and healthcare, and has different pricing tiers depending on your needs.

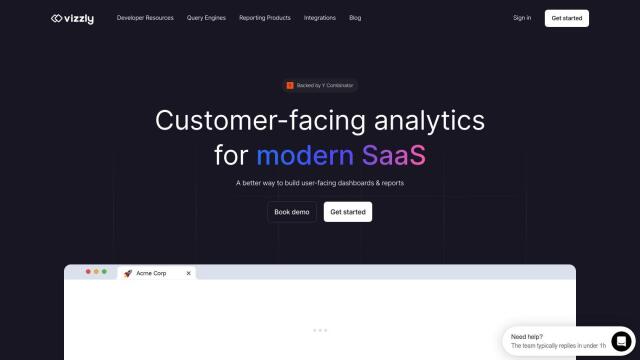
Vizzly
Last, Vizzly offers a no-code builder for creating interactive analytics dashboards, which is good for non-technical stakeholders. Vizzly lets you quickly deploy and customize, with features like native SDK-based embedding, data modeling and query connections to most SQL databases. By using Vizzly, companies can add analytics without much technical overhead, so they can improve user experience and get to market faster.

