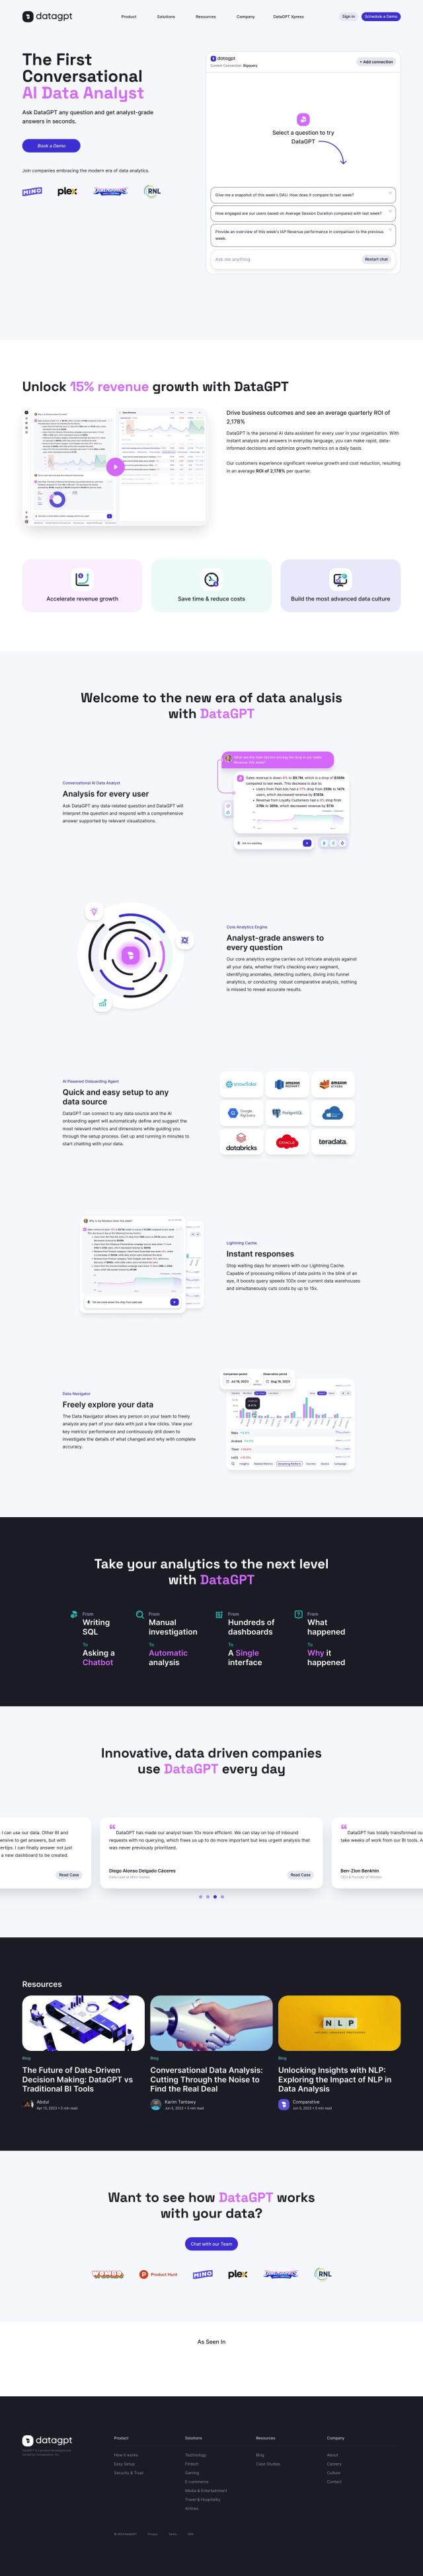
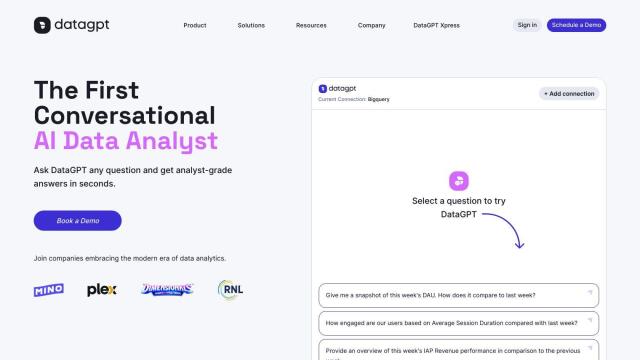
Question: I'm looking for a way to create compelling data stories and present results in a clear and concise manner.
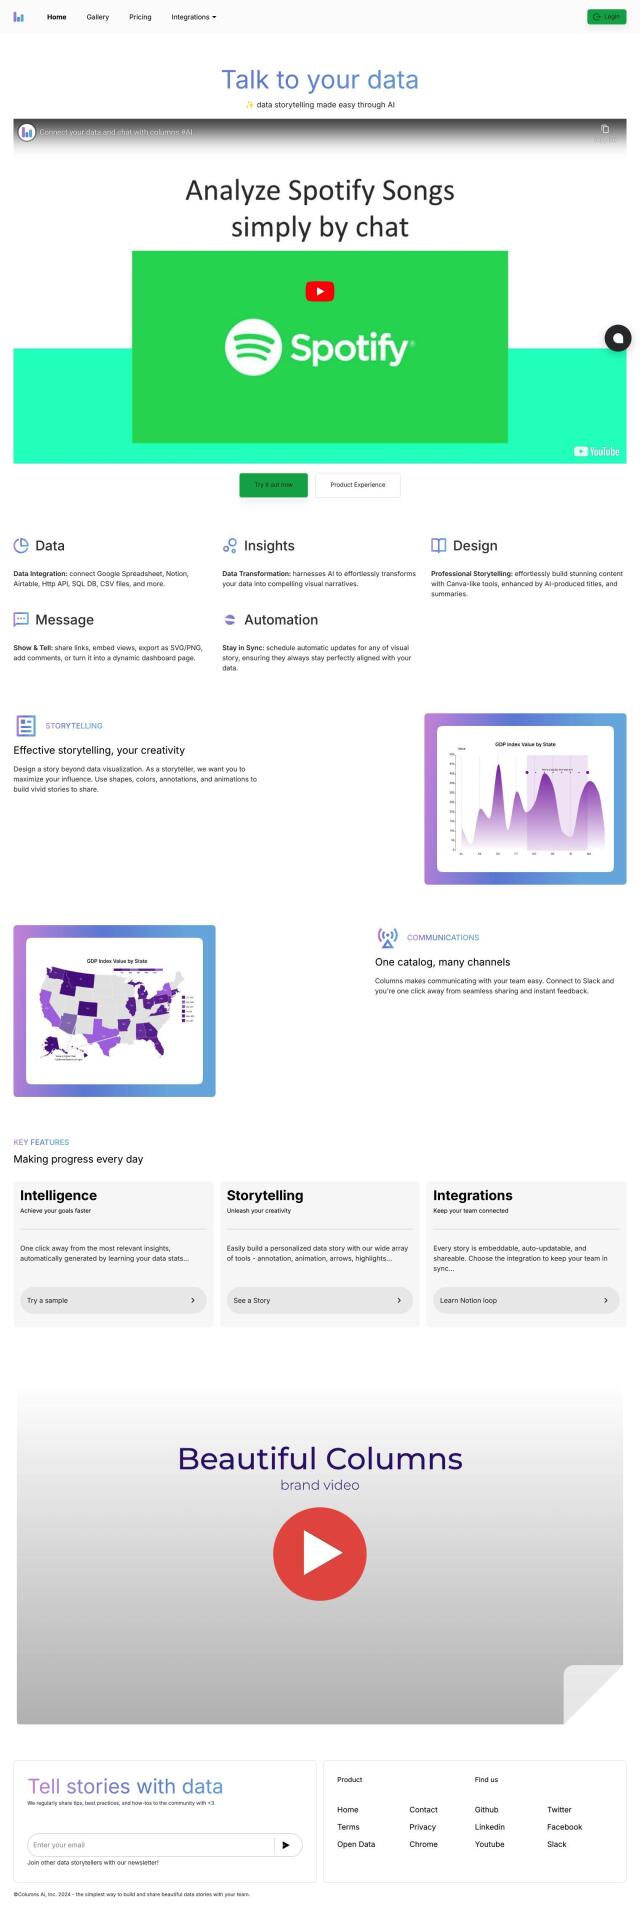
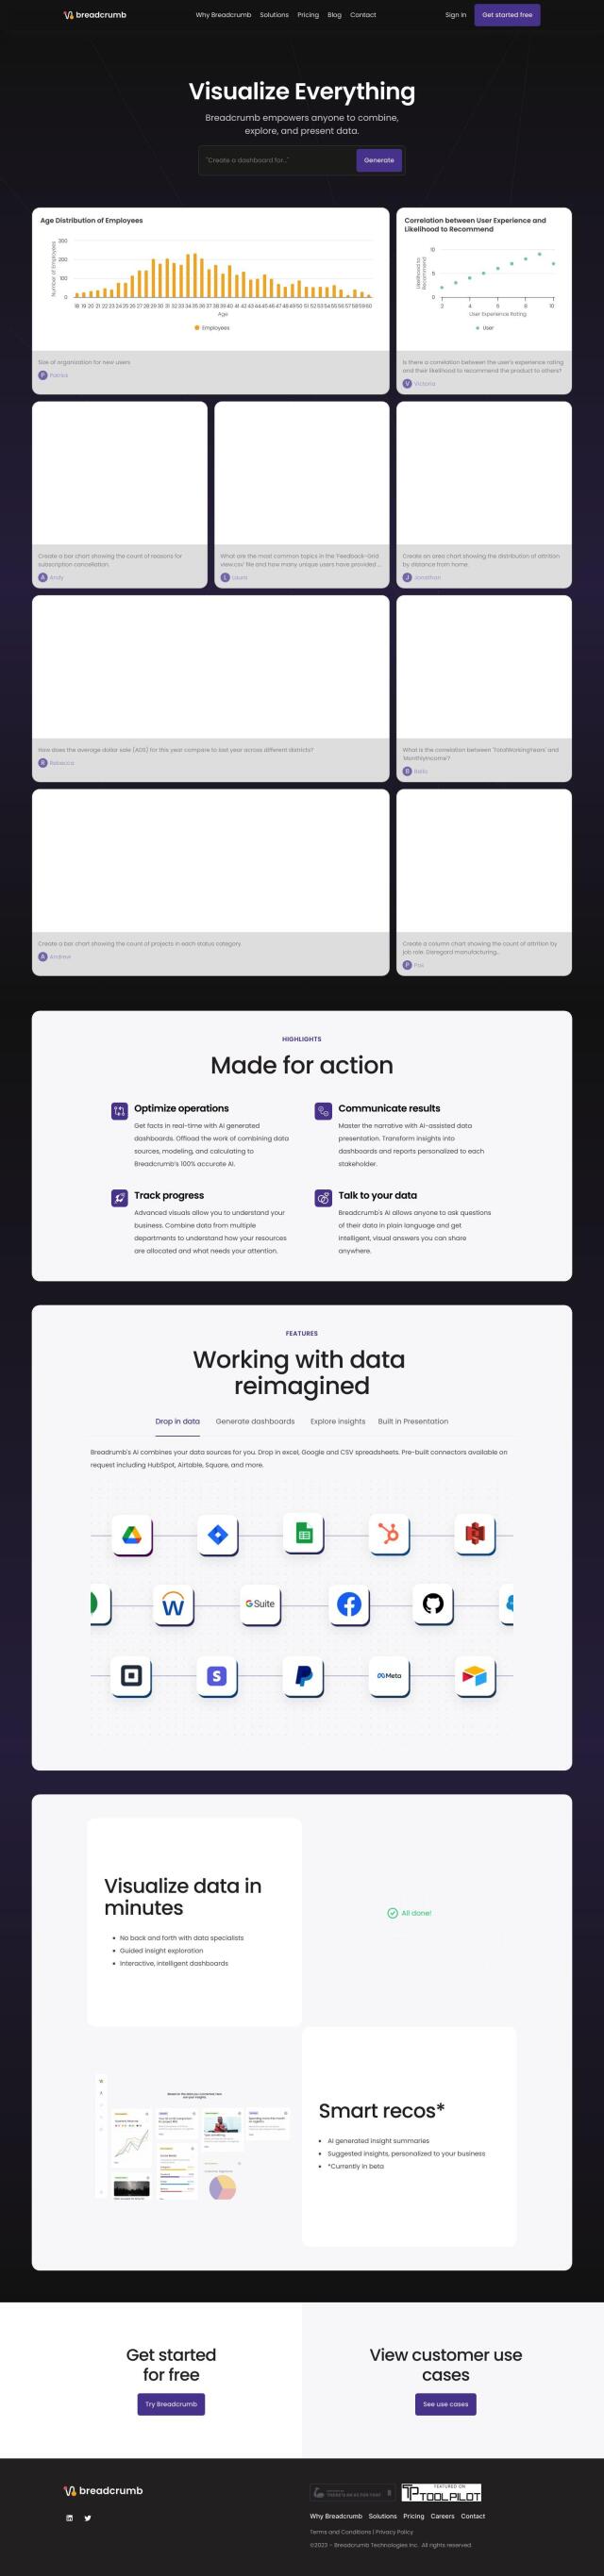
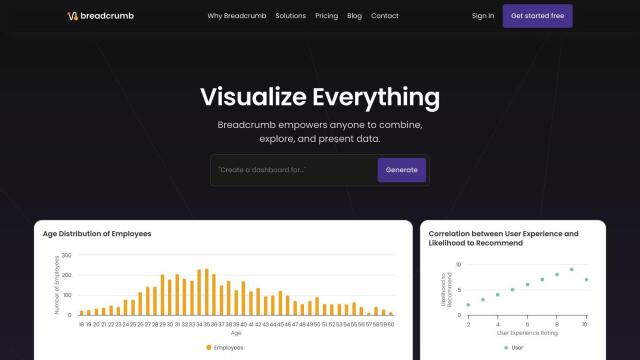
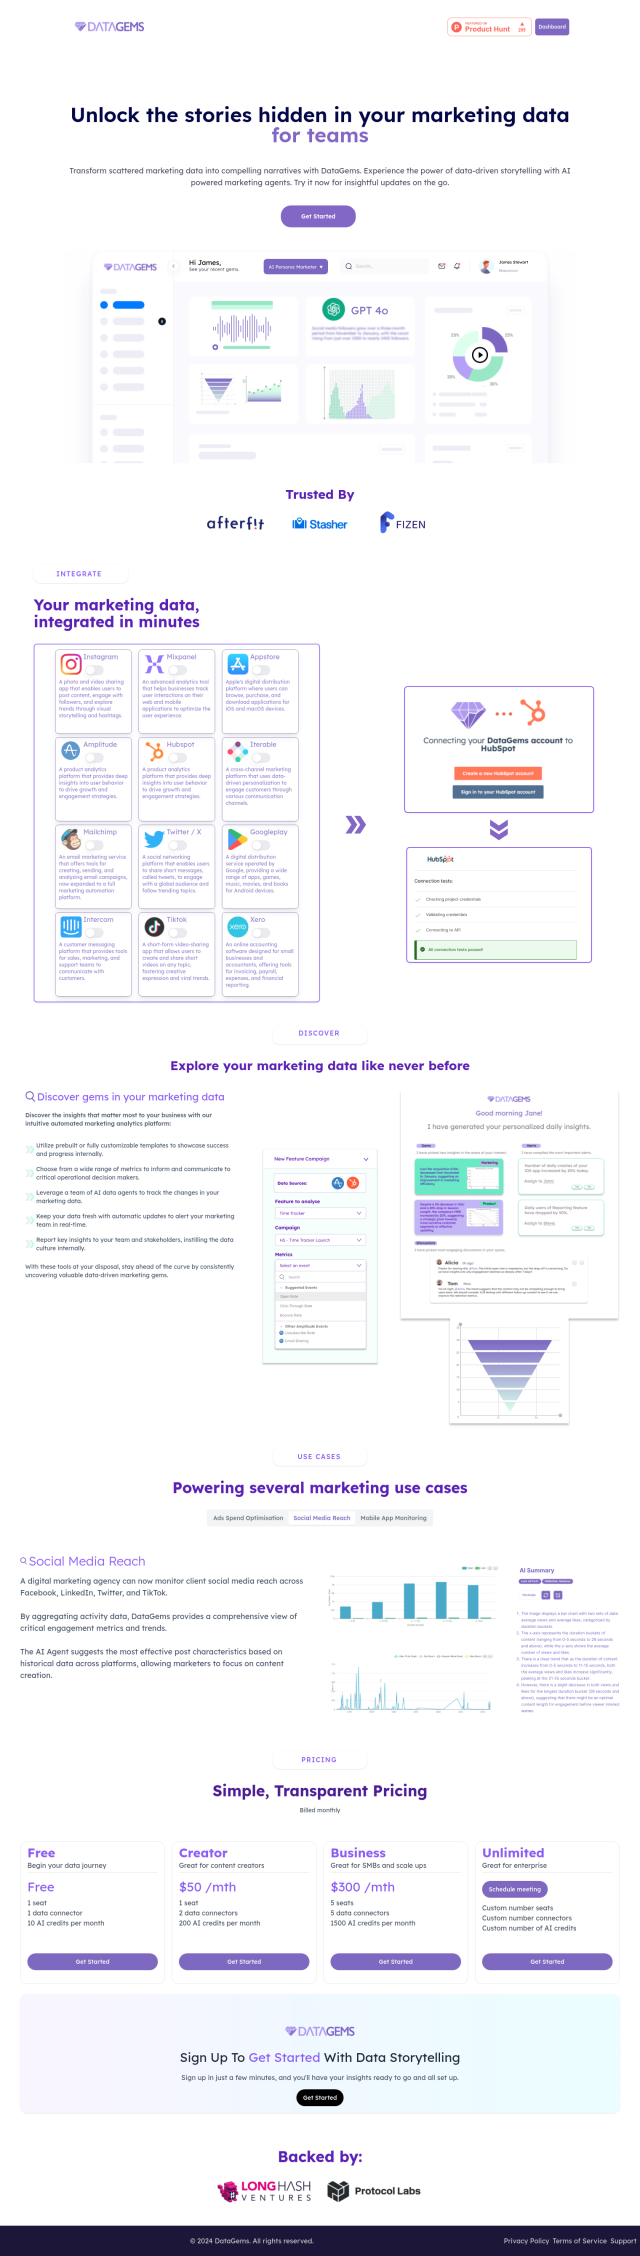
eqtble screenshot thumbnail

eqtble

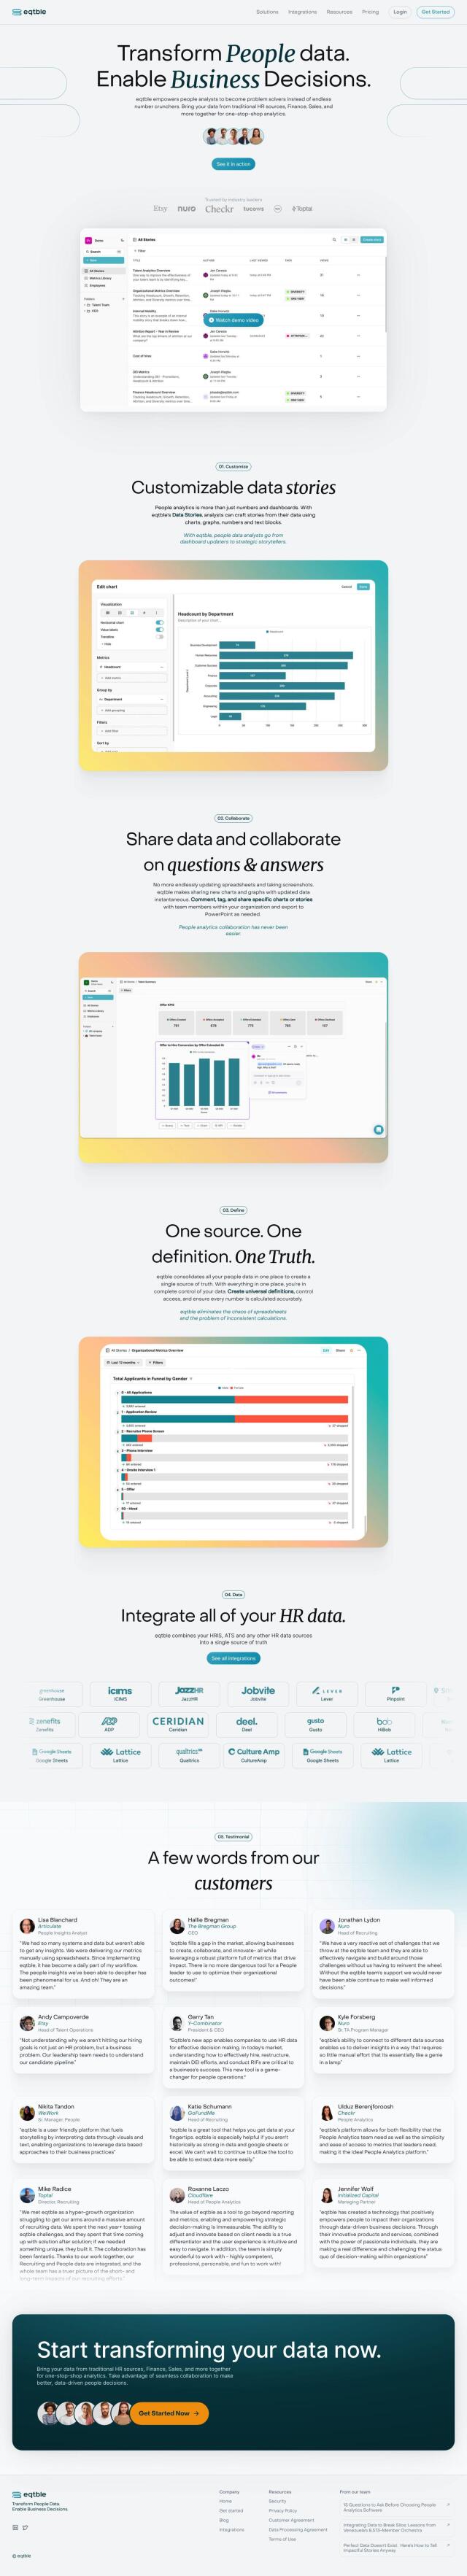
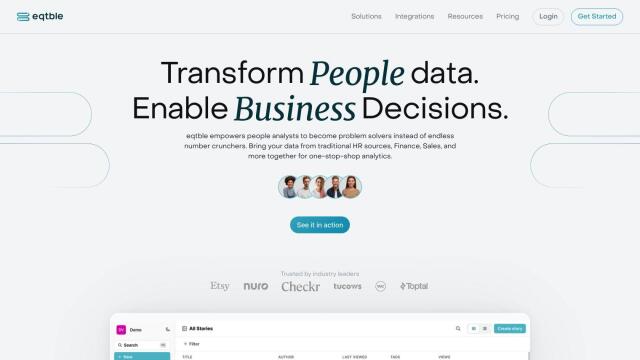
If you want to tell data stories and present results in a more engaging and digestible way, eqtble is a good choice. eqtble is a people analytics platform that collects data from different sources into one place so you can create interactive, narrative-driven reports with charts, graphs and text blocks. The platform can connect to a wide range of HR data sources and has a variety of pricing tiers, so it can work for companies with different needs.
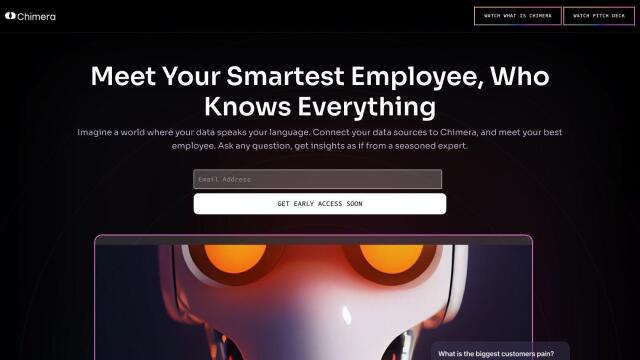
Decipad screenshot thumbnail

Decipad

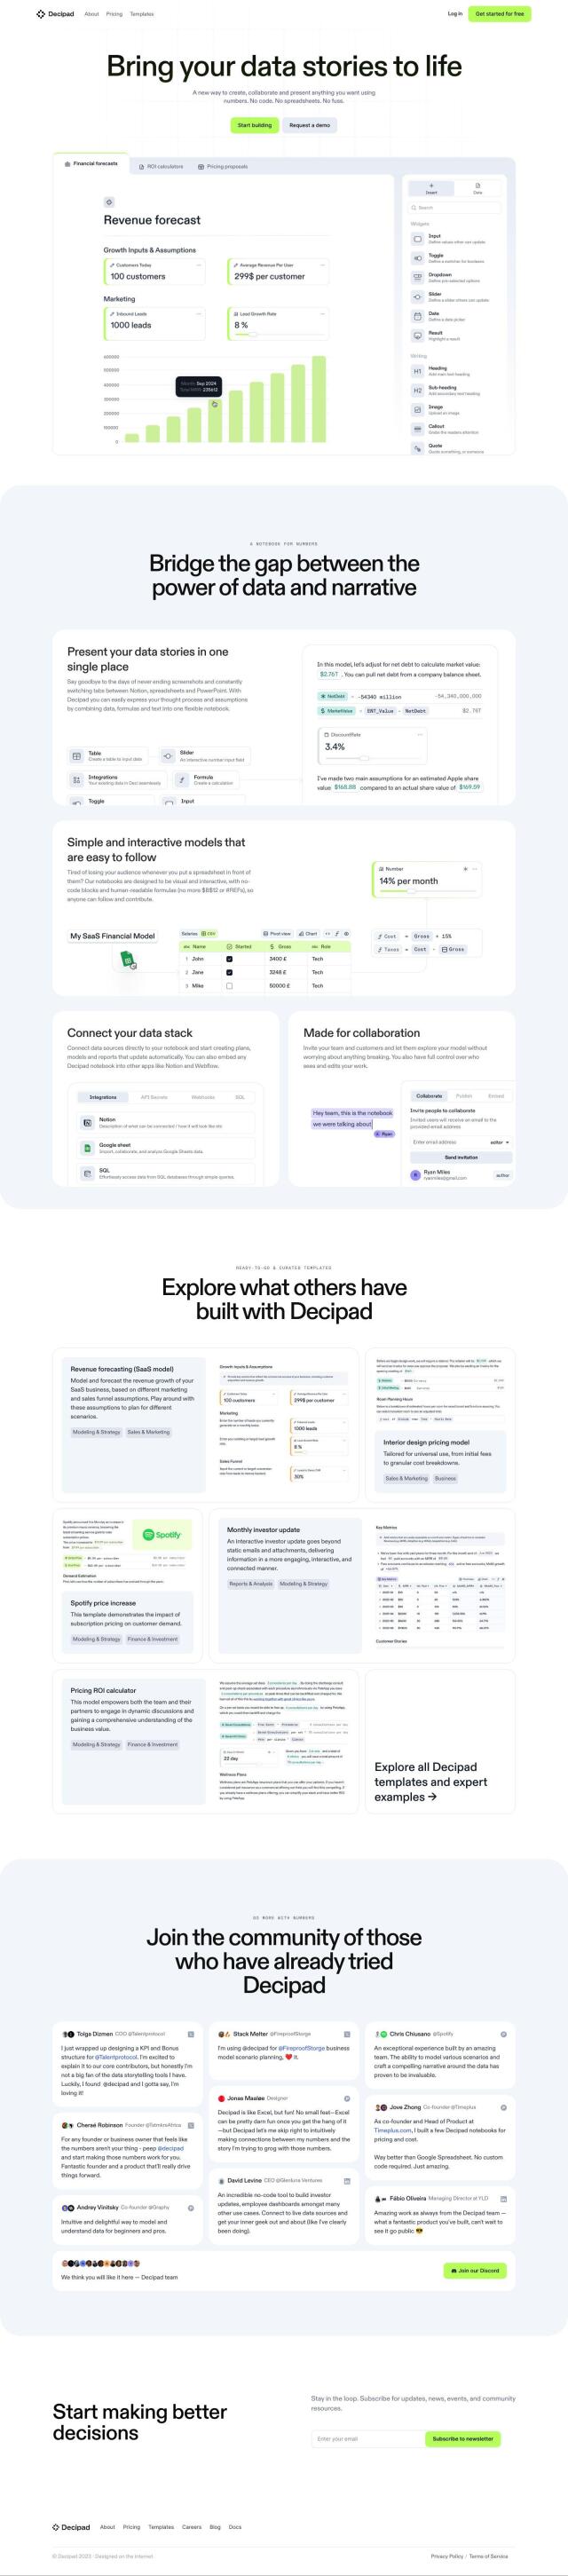
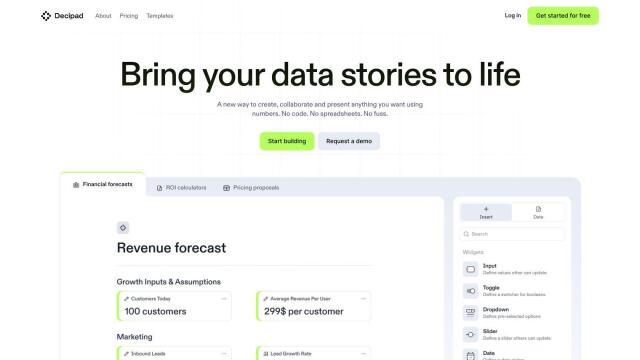
Another good option is Decipad, which combines documents and spreadsheets into a data-driven story. The platform combines data, formulas and text into a single flexible notebook, which can help with more transparent thinking and assumptions. It also offers interactive models, direct connections to many data sources and automatic updates so more people can understand data analysis and presentation.
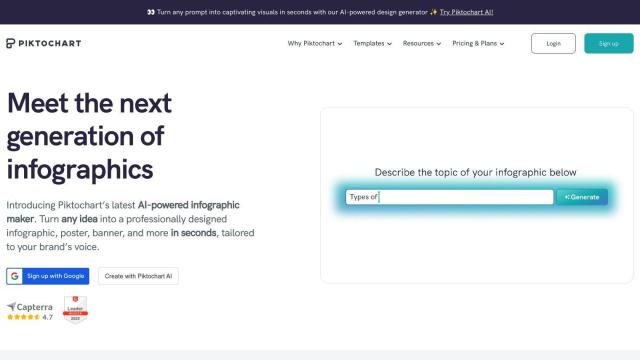
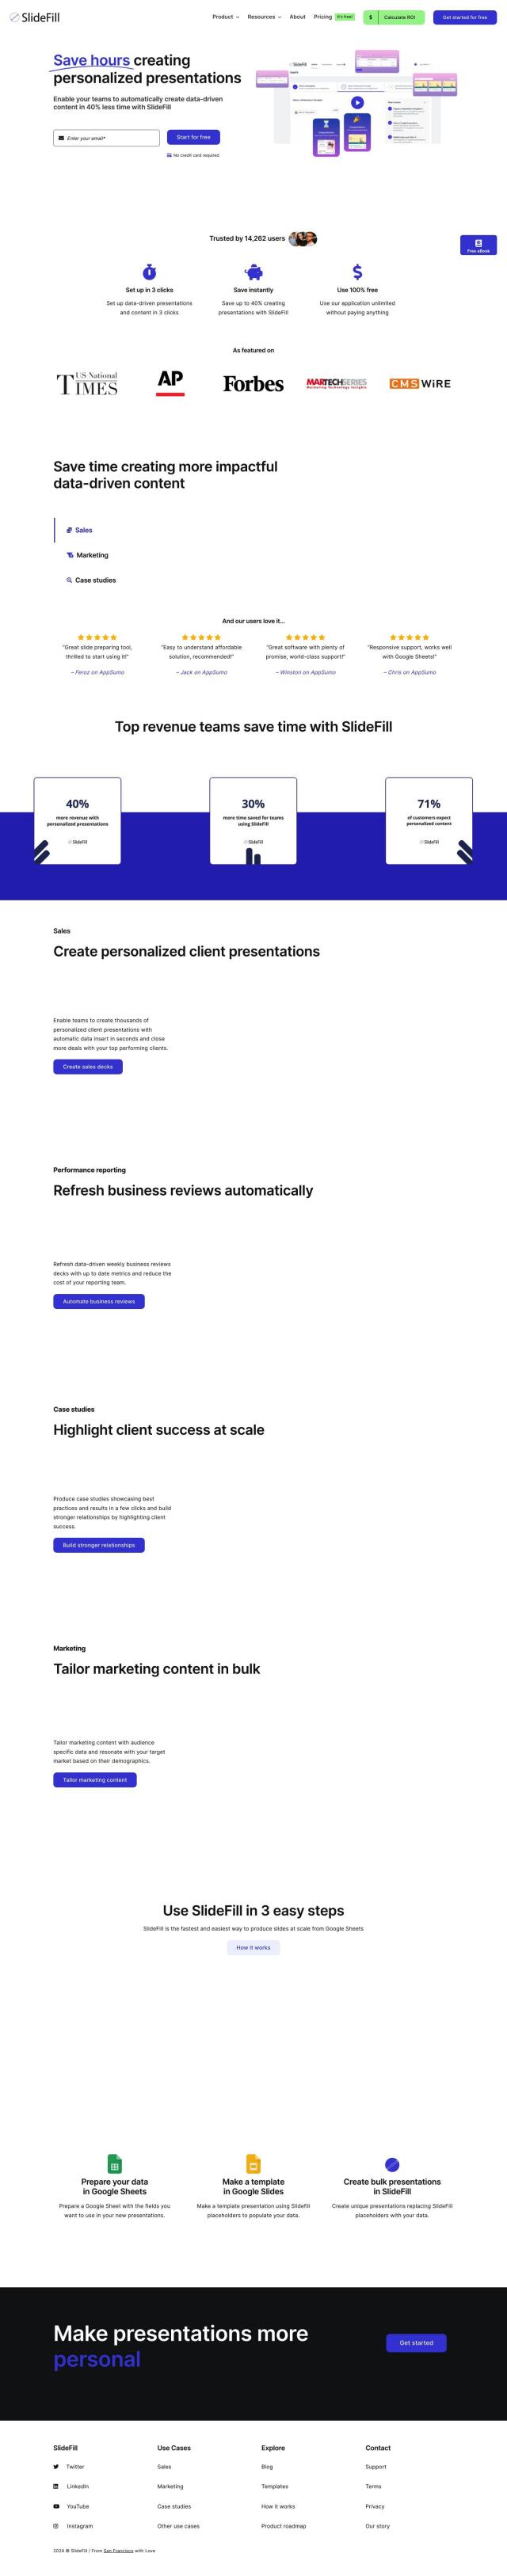
Piktochart screenshot thumbnail

Piktochart

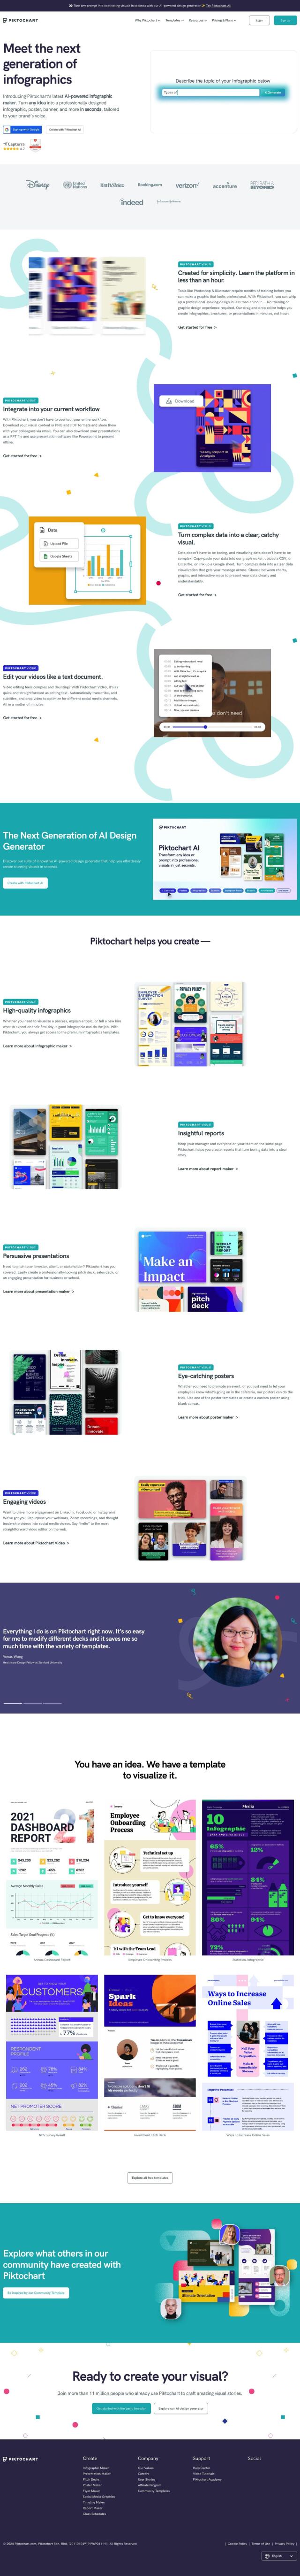
If you want to create graphics that look professional but don't have design skills, Piktochart is a good option. It uses a drag-and-drop interface to create AI-powered infographics with more than 230 professionally designed templates. It's good for marketers, salespeople and teachers who need to present information in an engaging way.
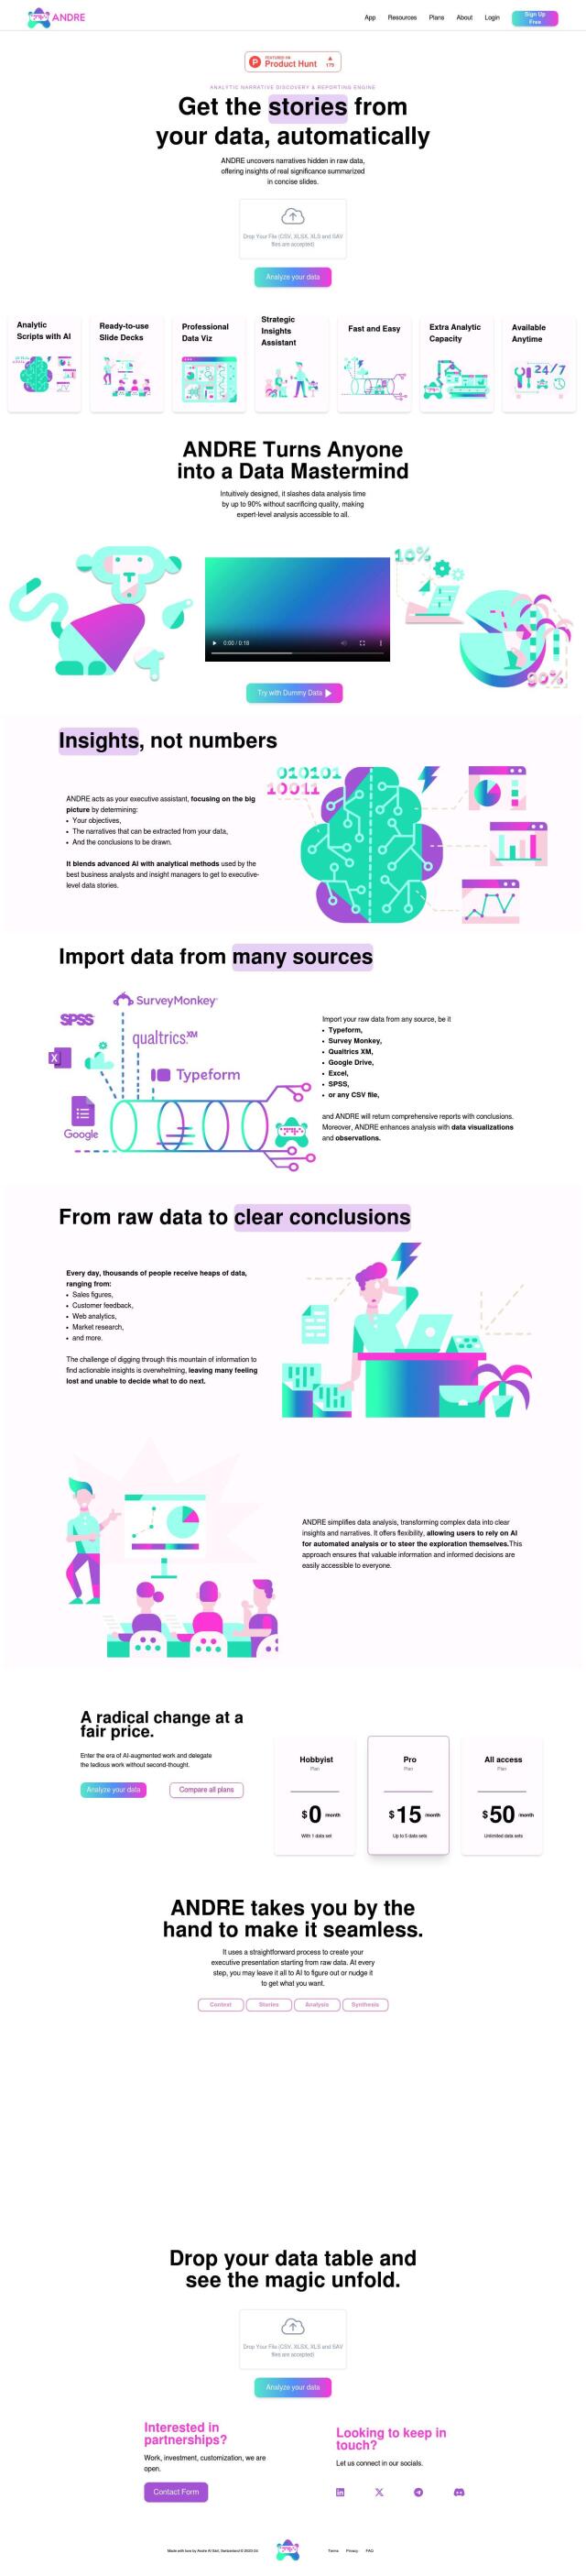
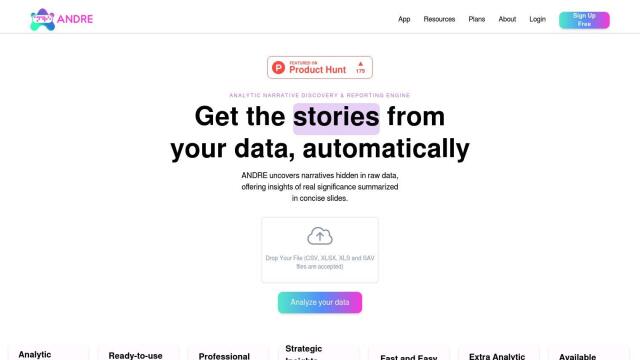
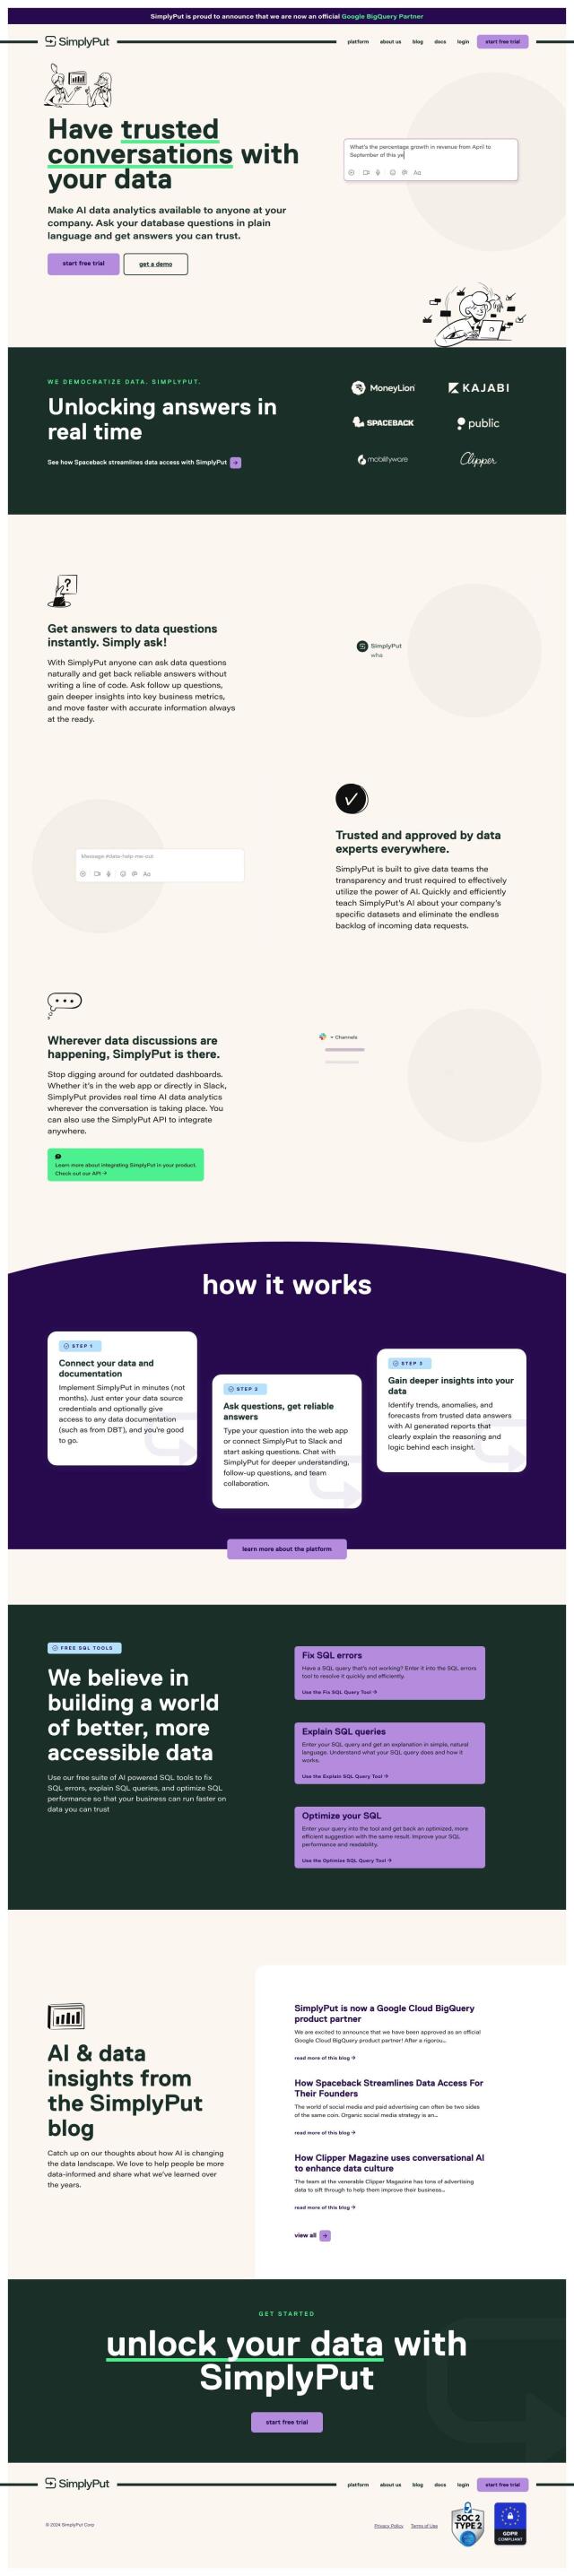
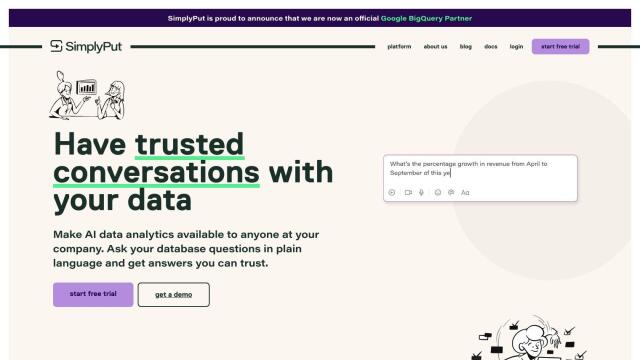
ANDRE screenshot thumbnail

ANDRE

If your focus is on survey data analysis, ANDRE can help you get expert-level insights and narratives out of raw data. It can import files from a variety of sources, and it has prebuilt slide decks, data visualization and a strategic insights assistant. It's good for people with varying levels of technical expertise and can save hours of data analysis time.

Additional AI Projects

Columns screenshot thumbnail

Columns

Collaborate on data visualization projects, manage data catalogs, and create compelling stories with AI-assisted insights, all in one self-service platform.

Narrative BI screenshot thumbnail

Narrative BI

Automatically generates personalized data narratives and alerts in plain language, transforming complex data into actionable insights for growth teams.

Visme screenshot thumbnail

Visme

Create on-brand content fast with AI-assisted design, templates, and collaboration tools, even without design experience.

Polymer screenshot thumbnail

Polymer

Converts complex data into intuitive, actionable visualizations, linking multiple sources and generating real-time insights with AI-driven analytics and suggested trends.

Onvo screenshot thumbnail

Onvo

Create interactive charts and insights with simple AI prompts, eliminating the need for complex queries and customizations.

Jeda.ai screenshot thumbnail

Jeda.ai

Collaborative, interactive canvas for creating, visualizing, and analyzing data, turning ideas into beautiful visuals and insights with advanced generative AI capabilities.

DataGPT screenshot thumbnail

DataGPT

Get instant, analyst-level answers to data questions in seconds, with automated insights and visualizations, making complex data analysis accessible to everyone.

Hex screenshot thumbnail

Hex

Unify data teams with AI-assisted exploration, collaboration, and interactive reporting, accelerating data work and improving accuracy in a single, modular workspace.

ThoughtSpot screenshot thumbnail

ThoughtSpot

Ask complex data questions in natural language and get instant AI-powered insights, empowering informed business decisions without requiring SQL or data expertise.

Storydoc screenshot thumbnail

Storydoc

Create interactive, engaging presentations that drive lead conversions and customer engagement with AI-generated decks, automatic slide design, and real-time analytics.

Graphy screenshot thumbnail

Graphy

Combine data from multiple sources into interactive, shareable reports in minutes, with AI-powered tools reducing creation time by 80%.

Storytell screenshot thumbnail

Storytell

Combines multiple large language models to automate repetitive tasks, organize data, and produce actionable insights, streamlining workflows for increased productivity.

Tabula screenshot thumbnail

Tabula

Automate data workflows, standardize disparate sources, and gain real-time insights without coding, empowering data-driven decision-making across departments.

Zing Data screenshot thumbnail

Zing Data

Get answers to data questions in seconds, without expertise, using intuitive natural language querying and automated data modeling.

Breadcrumb screenshot thumbnail

Breadcrumb

Transform data into interactive AI dashboards, connecting multiple sources, and track trends in real-time with 100% accurate visualizations and natural language queries.

SimplyPut screenshot thumbnail

SimplyPut

Ask data questions in plain language and get trusted answers without coding, with real-time analytics and AI-powered insights into trends, anomalies, and forecasts.

DataGems screenshot thumbnail

DataGems

Uncover hidden insights in marketing data with AI-powered agents, automated updates, and customizable templates, empowering teams to make data-driven decisions.

Chimera screenshot thumbnail

Chimera

Integrates disparate data sources, providing real-time answers to complex queries and customizable dashboards for informed decision-making.

SlideFill screenshot thumbnail

SlideFill

Automatically generates entire presentation decks in seconds, saving up to 40% of time, by tapping into Google Sheets data.

Vizzly screenshot thumbnail

Vizzly

Build and share interactive, customizable analytics experiences with a no-code dashboard builder, empowering users to explore data without technical hassle.