Question: Can you suggest a platform that allows me to easily visualize and share insights from multiple data sources?
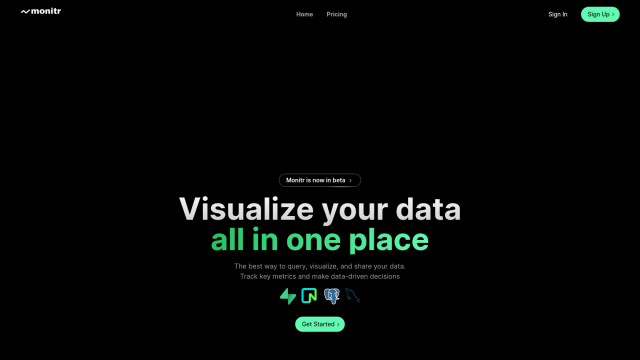
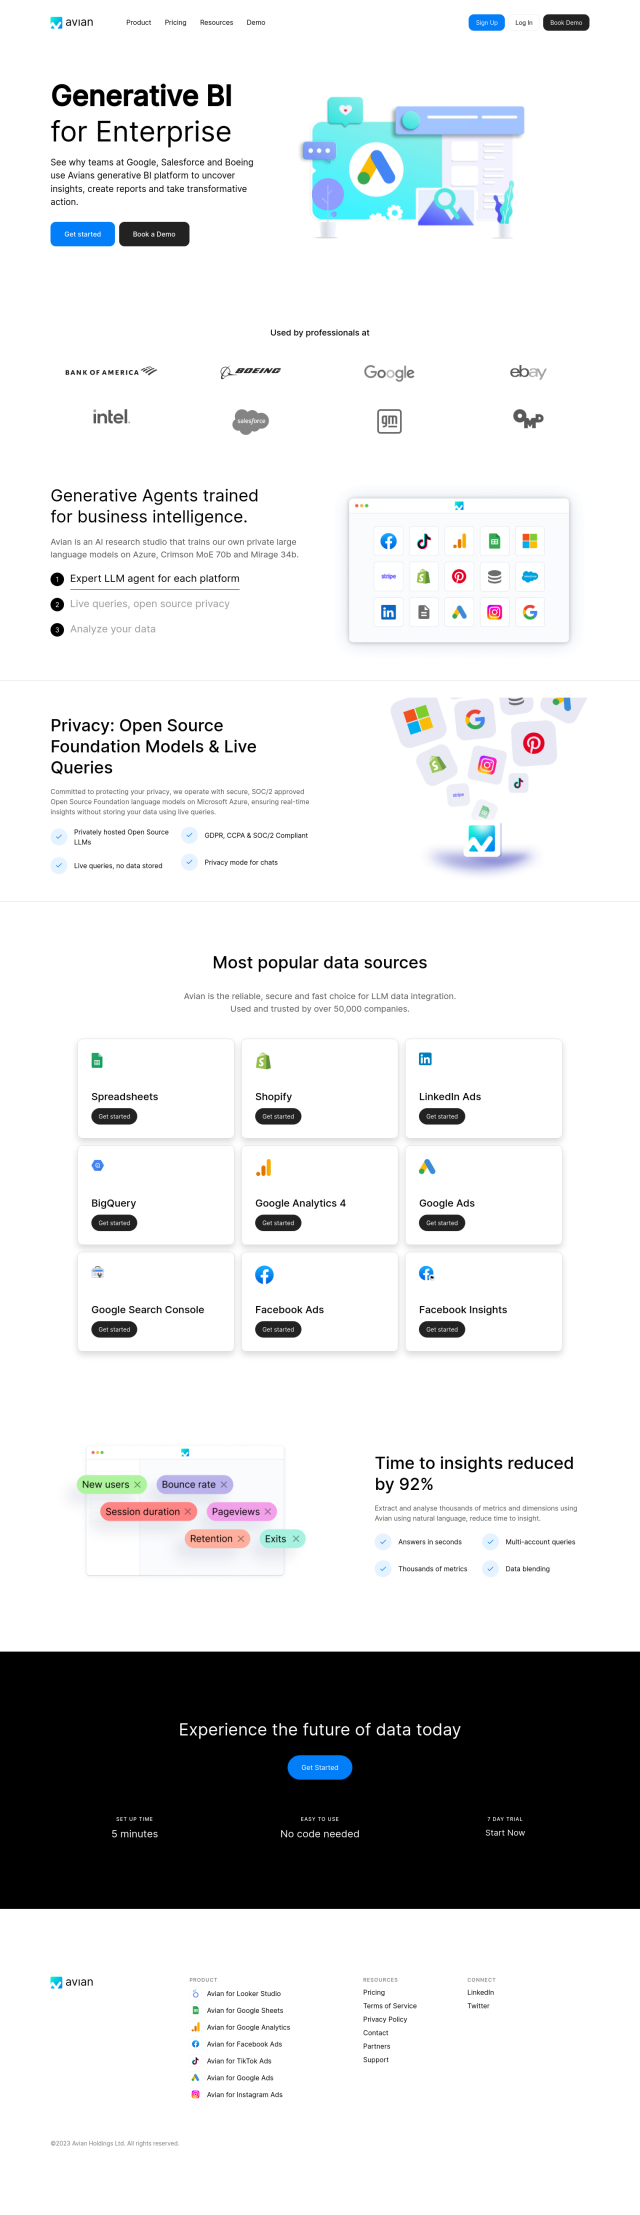
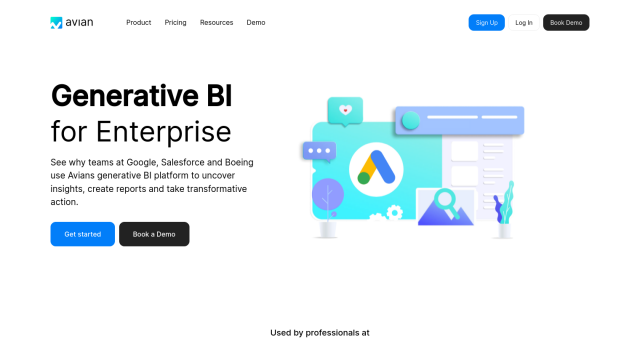
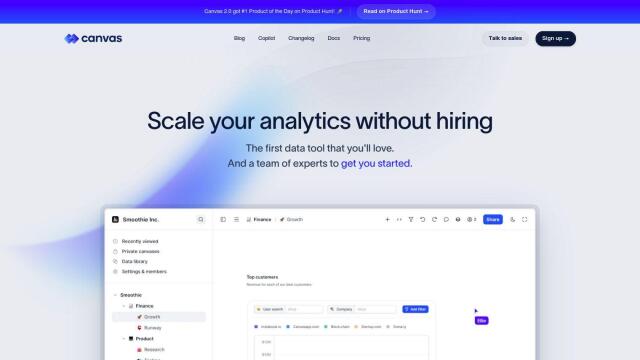
Monitr screenshot thumbnail

Monitr

If you need a platform for visualizing and sharing insights across multiple data sources, Monitr is worth a look. It offers a single view of data across Supabase, Postgresql, MySQL and other sources. Monitr offers collaborative SQL querying, chart and dashboard creation, and unlimited database connections, dashboards and queries on its free tier. Its Pro tier adds AI SQL query assistance and AI data analysis for more sophisticated analysis.
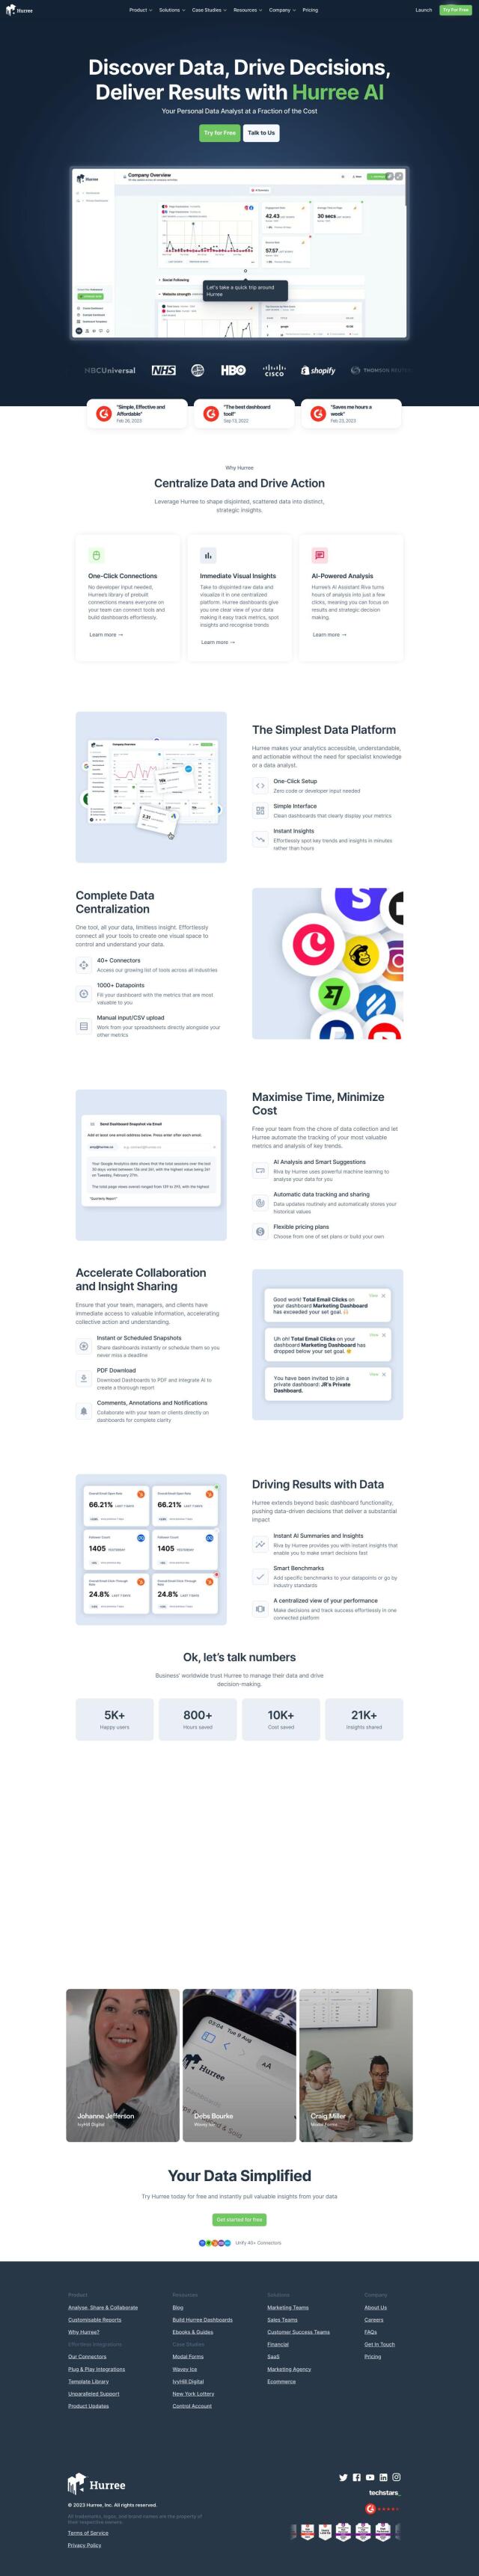
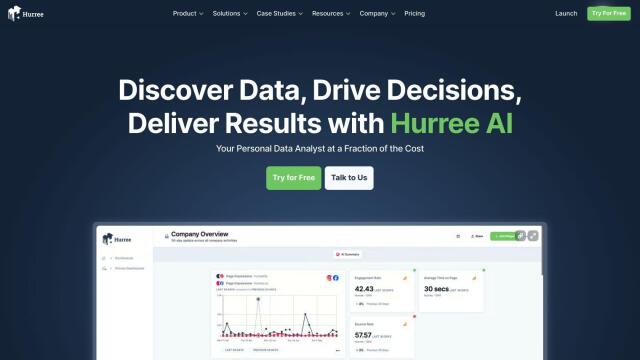
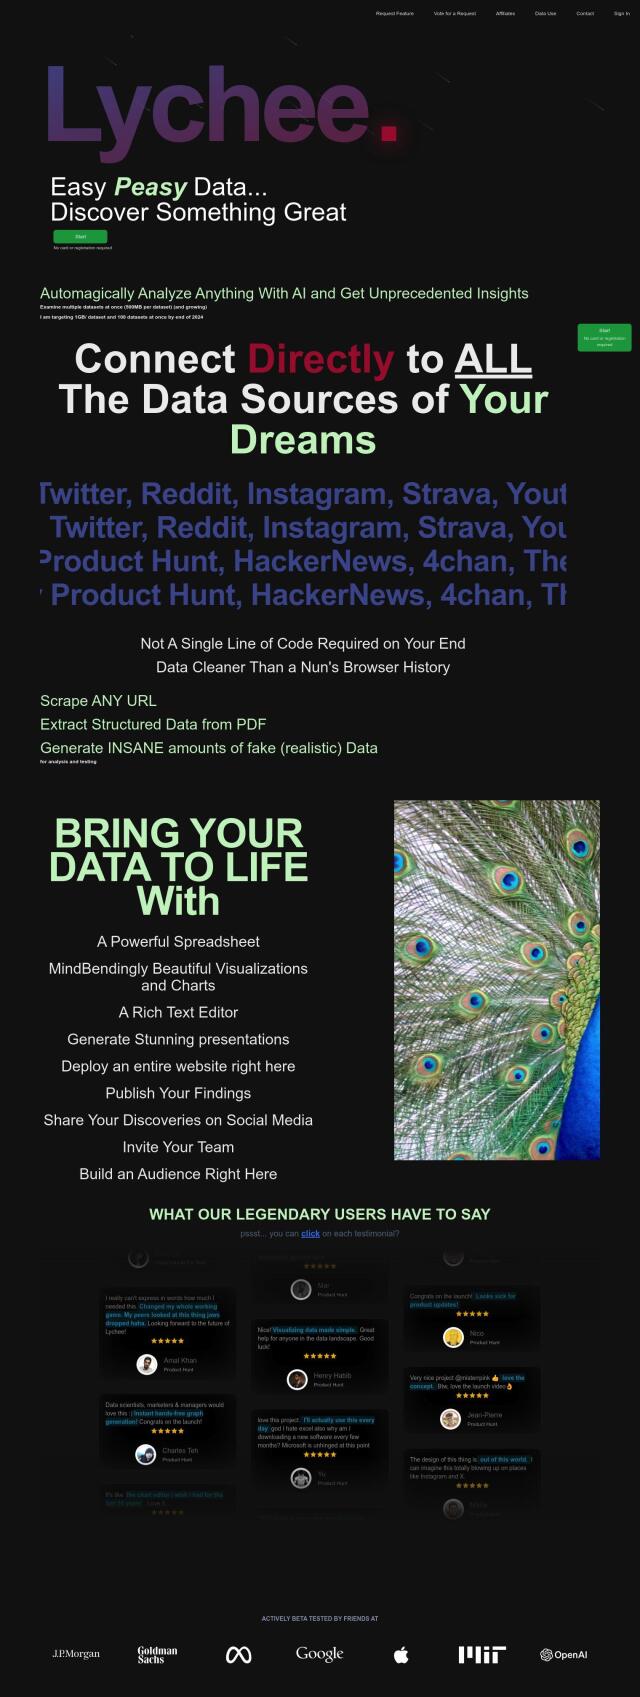
Hurree screenshot thumbnail

Hurree

Another strong contender is Hurree, which aggregates and visualizes data from multiple sources for quick insights. It offers one-click connections, AI-powered analysis and easy-to-understand interfaces. Hurree also lets you type in what you want to see, get immediate visualizations, and schedule snapshots and share dashboards with comments. That makes it a good choice for rapid collaboration and strategic planning.
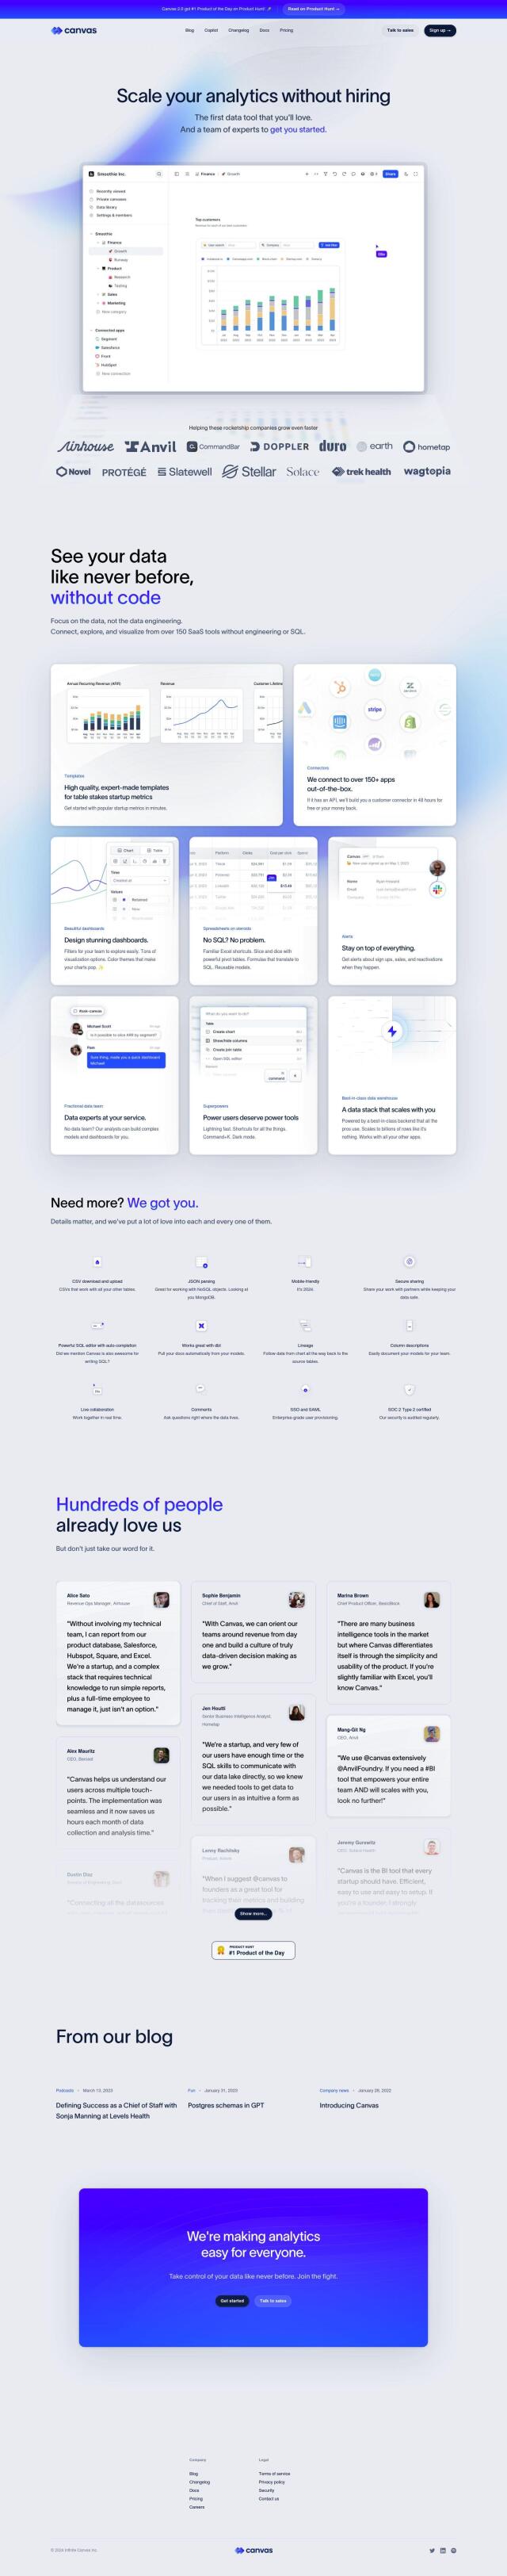
Onvo screenshot thumbnail

Onvo

If you prefer a more streamlined data visualization experience, Onvo offers AI-powered tools that let you create interactive charts and dashboards without having to write complicated queries. It supports multiple data sources and lets you share and embed results easily, making it good for startups and big businesses. Onvo's AI technology makes it easier to build engaging dashboards, cutting down on the time it takes to build them and making them more engaging for people using them.

Polymer screenshot thumbnail

Polymer

Last, Polymer is another AI-powered dashboard creation tool that turns raw data into insights. It connects to more than 20 data sources and can refresh dashboards automatically for up to real-time results. Polymer's AI-powered insights and personalized visualization means it's accessible to a broader range of people, making data-driven decisions more practical.

Additional AI Projects

Kanaries screenshot thumbnail

Kanaries

Explore and analyze data with a drag-and-drop interface, conversational insights, and seamless collaboration and sharing capabilities.

Airbook screenshot thumbnail

Airbook

Accelerate data analysis and insights generation across teams with native connectors to 150+ data sources, collaborative querying, and visualization tools.

ThoughtSpot screenshot thumbnail

ThoughtSpot

Ask complex data questions in natural language and get instant AI-powered insights, empowering informed business decisions without requiring SQL or data expertise.

Breadcrumb screenshot thumbnail

Breadcrumb

Transform data into interactive AI dashboards, connecting multiple sources, and track trends in real-time with 100% accurate visualizations and natural language queries.

Avian screenshot thumbnail

Avian

Analyze complex data sets with natural language processing, extracting key metrics in seconds, without storing data, and ensuring real-time insights and compliance.

Lychee screenshot thumbnail

Lychee

Analyze multiple data sets at once, connecting directly to various sources, without coding, and visualize insights with informative charts and polished presentations.

Graphy screenshot thumbnail

Graphy

Combine data from multiple sources into interactive, shareable reports in minutes, with AI-powered tools reducing creation time by 80%.

Canvas screenshot thumbnail

Canvas

Link, query, and visualize data from 150+ SaaS tools without coding, empowering non-technical teams to make data-informed decisions.

Jeda.ai screenshot thumbnail

Jeda.ai

Collaborative, interactive canvas for creating, visualizing, and analyzing data, turning ideas into beautiful visuals and insights with advanced generative AI capabilities.

Hex screenshot thumbnail

Hex

Unify data teams with AI-assisted exploration, collaboration, and interactive reporting, accelerating data work and improving accuracy in a single, modular workspace.

DataChat screenshot thumbnail

DataChat

Access complex data insights without coding, using a familiar chat and spreadsheet interface to generate transparent, reproducible results.

Genie screenshot thumbnail

Genie

Ask data questions in natural language and get instant answers and visualizations, without requiring complex SQL or technical expertise.

Tabula screenshot thumbnail

Tabula

Automate data workflows, standardize disparate sources, and gain real-time insights without coding, empowering data-driven decision-making across departments.

DataSquirrel screenshot thumbnail

DataSquirrel

Upload, clean, analyze, and visualize data with a few clicks, automating tasks to gain fast insights and make data-driven decisions independently.

Vizly screenshot thumbnail

Vizly

Interactively analyze data by asking questions, visualizing results, and performing advanced analysis to uncover insights and predictions.

Rasgo screenshot thumbnail

Rasgo

Ask plain language questions and get instant, automated insights with 24/7 intelligent analysis, secured and customized with business context and visualizations.

Explo screenshot thumbnail

Explo

Embed interactive dashboards and self-serve reporting directly into products, enabling end-users to customize analytics experiences and make better decisions.

Dataloop screenshot thumbnail

Dataloop

Unify data, models, and workflows in one environment, automating pipelines and incorporating human feedback to accelerate AI application development and improve quality.

Vizzly screenshot thumbnail

Vizzly

Build and share interactive, customizable analytics experiences with a no-code dashboard builder, empowering users to explore data without technical hassle.

Chimera screenshot thumbnail

Chimera

Integrates disparate data sources, providing real-time answers to complex queries and customizable dashboards for informed decision-making.