Question: I need a technical spreadsheet that can handle large datasets and provides interactive visualization capabilities.

Quadratic screenshot thumbnail

Quadratic

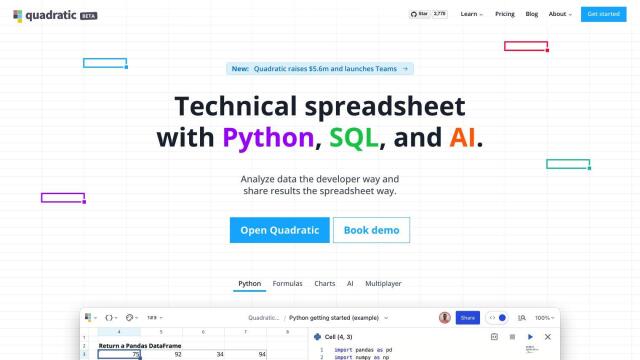
Quadratic is a collaborative, technical spreadsheet that uses Python, SQL and AI. It's got infinite canvas navigation, real-time collaboration and AI-powered autocomplete. Quadratic supports formulas, programming languages and interactive charts created with Plotly. It can import data from outside APIs and programmatically add data with libraries like Pandas and NumPy.

Luminal screenshot thumbnail

Luminal

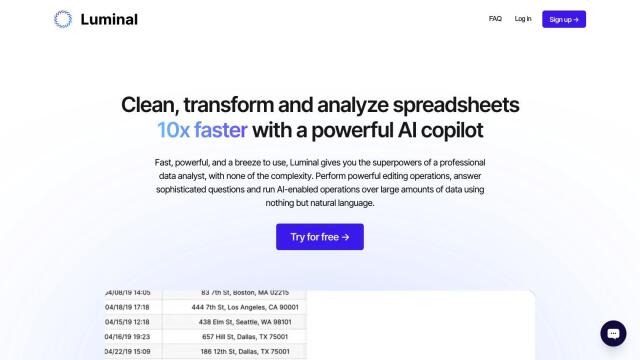
Luminal is another good option, in particular if you need to process, transform and analyze big data as fast as possible. It can handle tens of thousands of rows and supports a variety of file formats. Luminal has an AI copilot for data cleaning, structuring and quick analysis. It also can create data visualizations, generating graphs, charts and maps with natural language prompts.

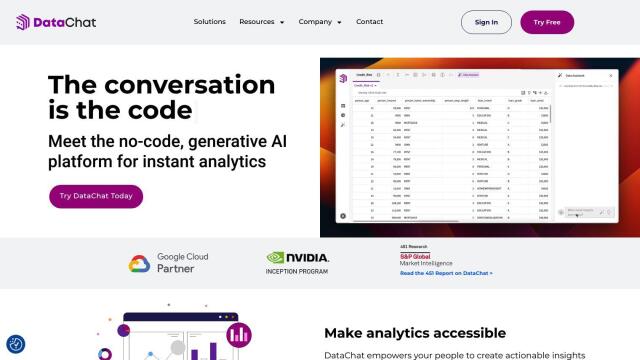
DataChat screenshot thumbnail

DataChat

DataChat is a no-code interface that can turn complex data into information you can use with generative AI. It's got an interface that's like a familiar spreadsheet and chat software, so you can work in chat boxes and spreadsheets without having to write code. DataChat automates data prep, exploration and modeling, so it's good for data scientists, analysts and business users who need to make decisions fast and with confidence.

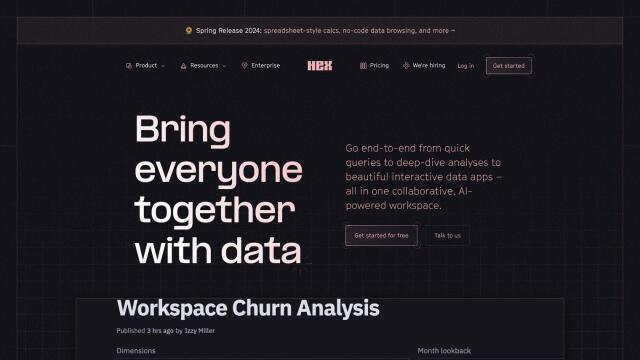
Hex screenshot thumbnail

Hex

Last, Hex is an AI-augmented collaborative workspace for data teams. It's got features like data exploration on modular canvases, AI-assisted query generation and interactive reporting. Hex supports SQL, Python, R and other tools and has enterprise-level security. It's good for teams that need more-advanced data clustering, modeling and visualization.

Additional AI Projects

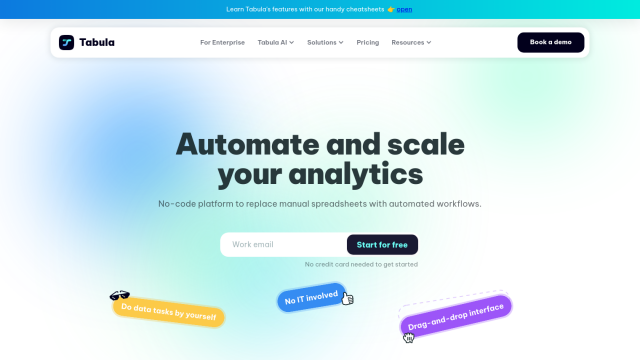
Tabula screenshot thumbnail

Tabula

Automate data workflows, standardize disparate sources, and gain real-time insights without coding, empowering data-driven decision-making across departments.

Spreadsheet.com screenshot thumbnail

Spreadsheet.com

Combines spreadsheet interface with automation, customizable views, and integrations to streamline project management, data tracking, and team collaboration.

ThoughtSpot screenshot thumbnail

ThoughtSpot

Ask complex data questions in natural language and get instant AI-powered insights, empowering informed business decisions without requiring SQL or data expertise.

Airbook screenshot thumbnail

Airbook

Accelerate data analysis and insights generation across teams with native connectors to 150+ data sources, collaborative querying, and visualization tools.

Formula Bot screenshot thumbnail

Formula Bot

Turns text into various outputs, including Excel formulas, SQL queries, and more, to accelerate data analysis and spreadsheet workflows.

Onvo screenshot thumbnail

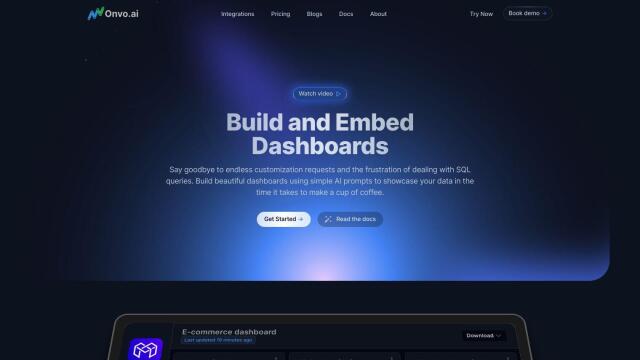
Onvo

Create interactive charts and insights with simple AI prompts, eliminating the need for complex queries and customizations.

DataGPT screenshot thumbnail

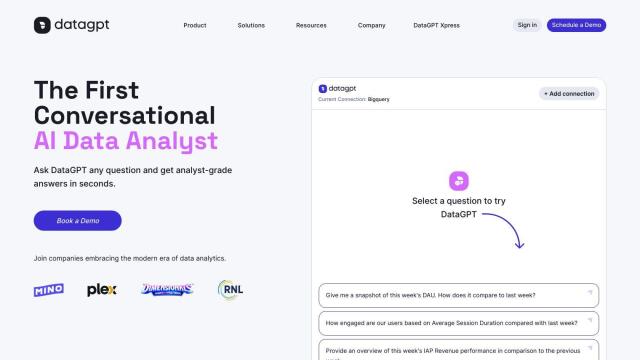
DataGPT

Get instant, analyst-level answers to data questions in seconds, with automated insights and visualizations, making complex data analysis accessible to everyone.

Causal screenshot thumbnail

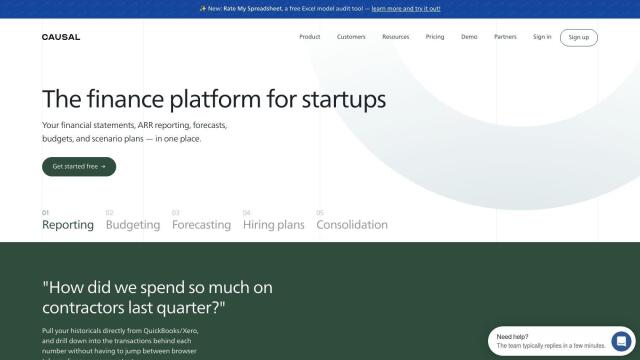
Causal

Build financial models by connecting to multiple data sources, and analyze your business with human-readable formulas and granular permissions.

Explo screenshot thumbnail

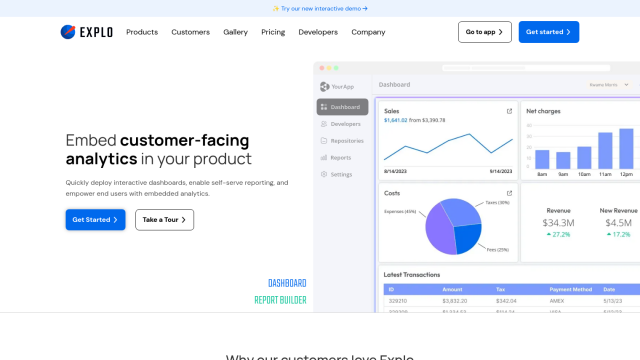
Explo

Embed interactive dashboards and self-serve reporting directly into products, enabling end-users to customize analytics experiences and make better decisions.

Vizly screenshot thumbnail

Vizly

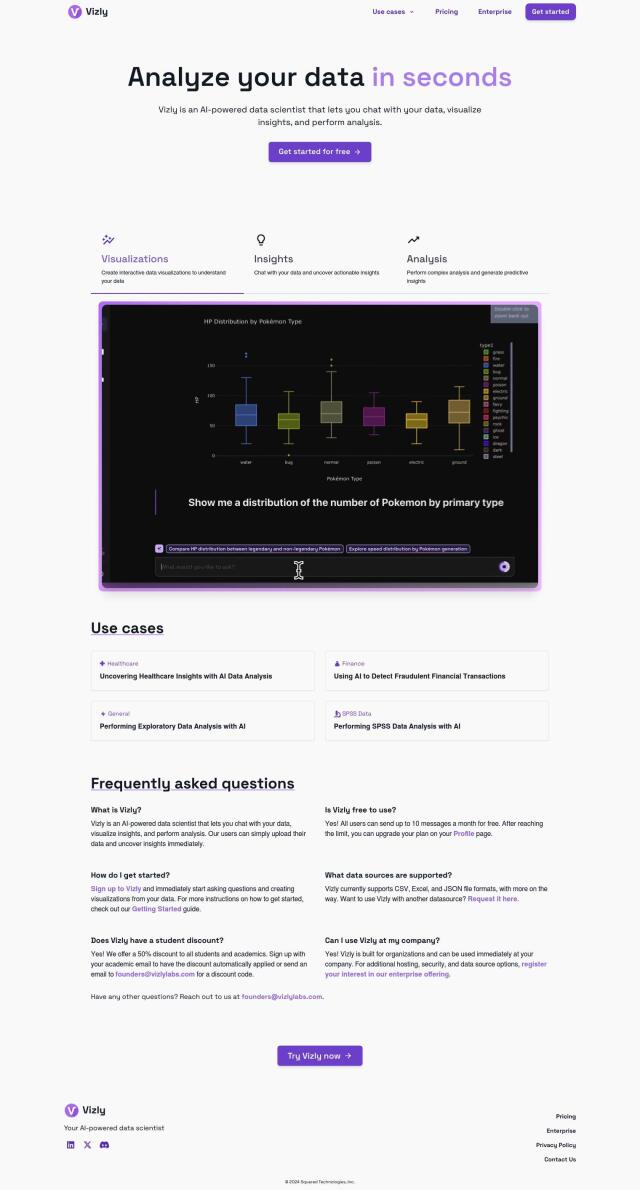
Interactively analyze data by asking questions, visualizing results, and performing advanced analysis to uncover insights and predictions.

Genie screenshot thumbnail

Genie

Ask data questions in natural language and get instant answers and visualizations, without requiring complex SQL or technical expertise.

Canvas screenshot thumbnail

Canvas

Link, query, and visualize data from 150+ SaaS tools without coding, empowering non-technical teams to make data-informed decisions.

Polymer screenshot thumbnail

Polymer

Converts complex data into intuitive, actionable visualizations, linking multiple sources and generating real-time insights with AI-driven analytics and suggested trends.

Neptyne screenshot thumbnail

Neptyne

Run Python code directly in Google Sheets, integrating with popular data science tools and enabling advanced data analysis, processing, and visualization capabilities.

Numerous.ai screenshot thumbnail

Numerous.ai

Embeds ChatGPT into Google Sheets and Excel, enabling easy access to AI abilities without API keys, for streamlined team collaboration and cost-effective results.

ANDRE screenshot thumbnail

ANDRE

Automates survey data analysis, transforming raw data into clear insights and stories with professional slide decks and strategic guidance.

Dataloop screenshot thumbnail

Dataloop

Unify data, models, and workflows in one environment, automating pipelines and incorporating human feedback to accelerate AI application development and improve quality.

ChatDB screenshot thumbnail

ChatDB

Query your database using natural language, with AI generating the necessary SQL, and create engaging charts for quick business insights.

Vizzly screenshot thumbnail

Vizzly

Build and share interactive, customizable analytics experiences with a no-code dashboard builder, empowering users to explore data without technical hassle.

SingleStore screenshot thumbnail

SingleStore

Combines transactional and analytical capabilities in a single engine, enabling millisecond query performance and real-time data processing for smart apps and AI workloads.