Question: Can you recommend a tool that provides interactive visual analytics and real-time insights for large-scale data sets?

Tableau screenshot thumbnail

Tableau

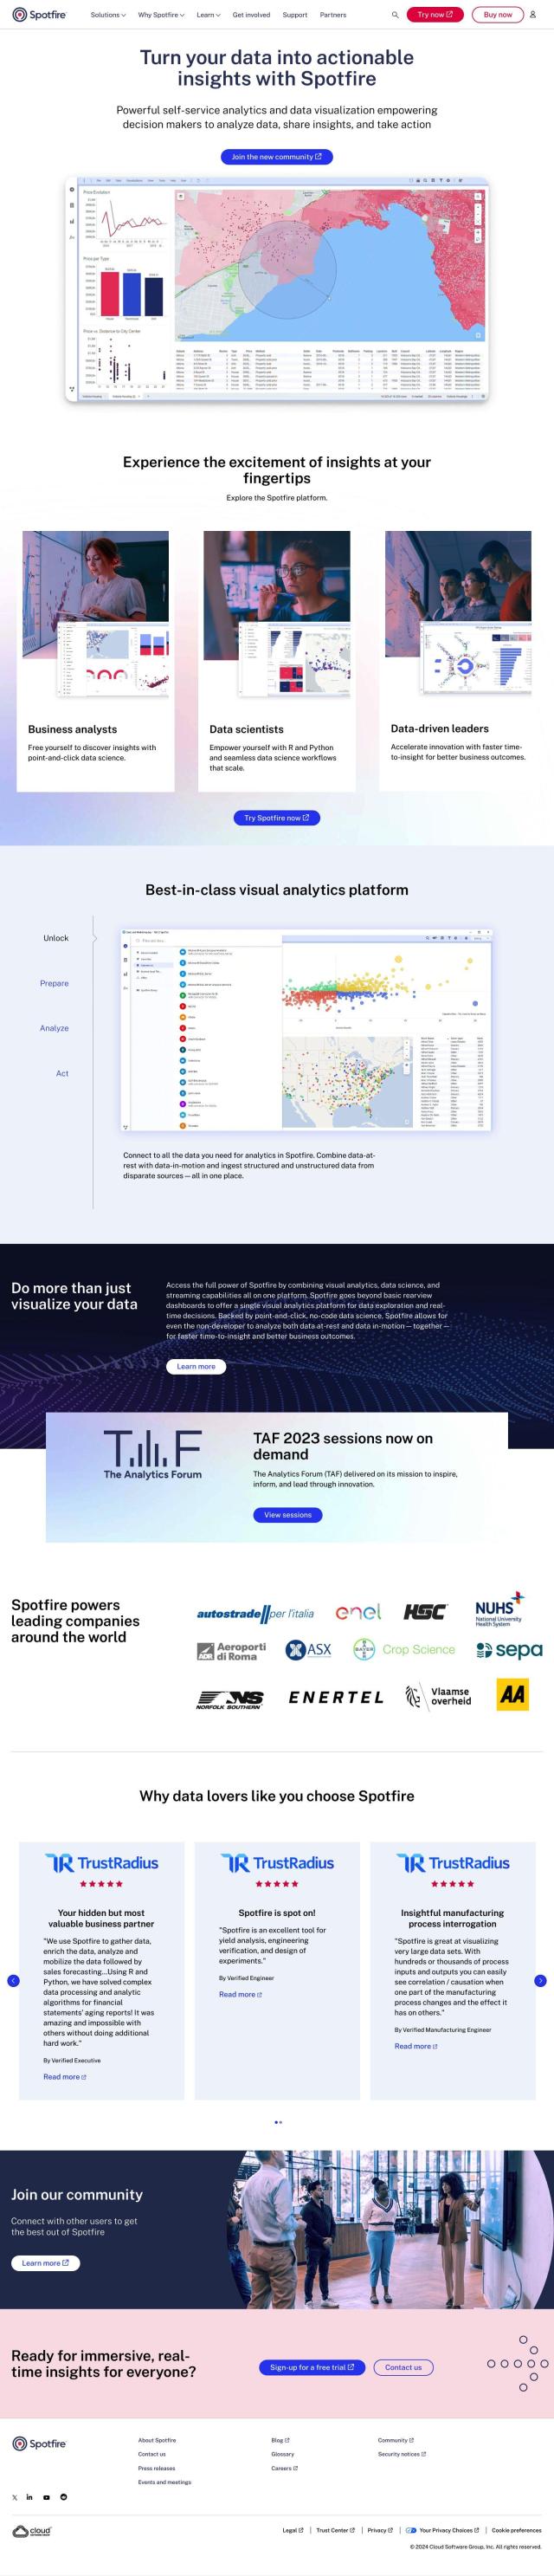
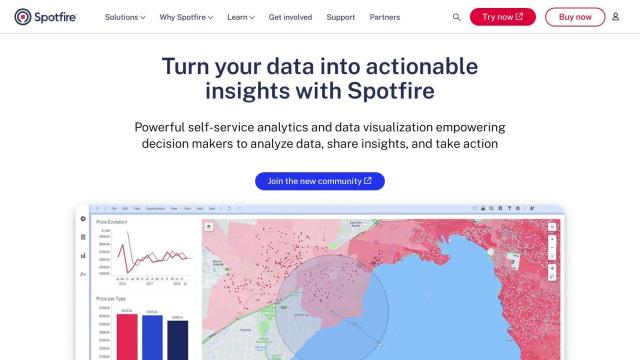
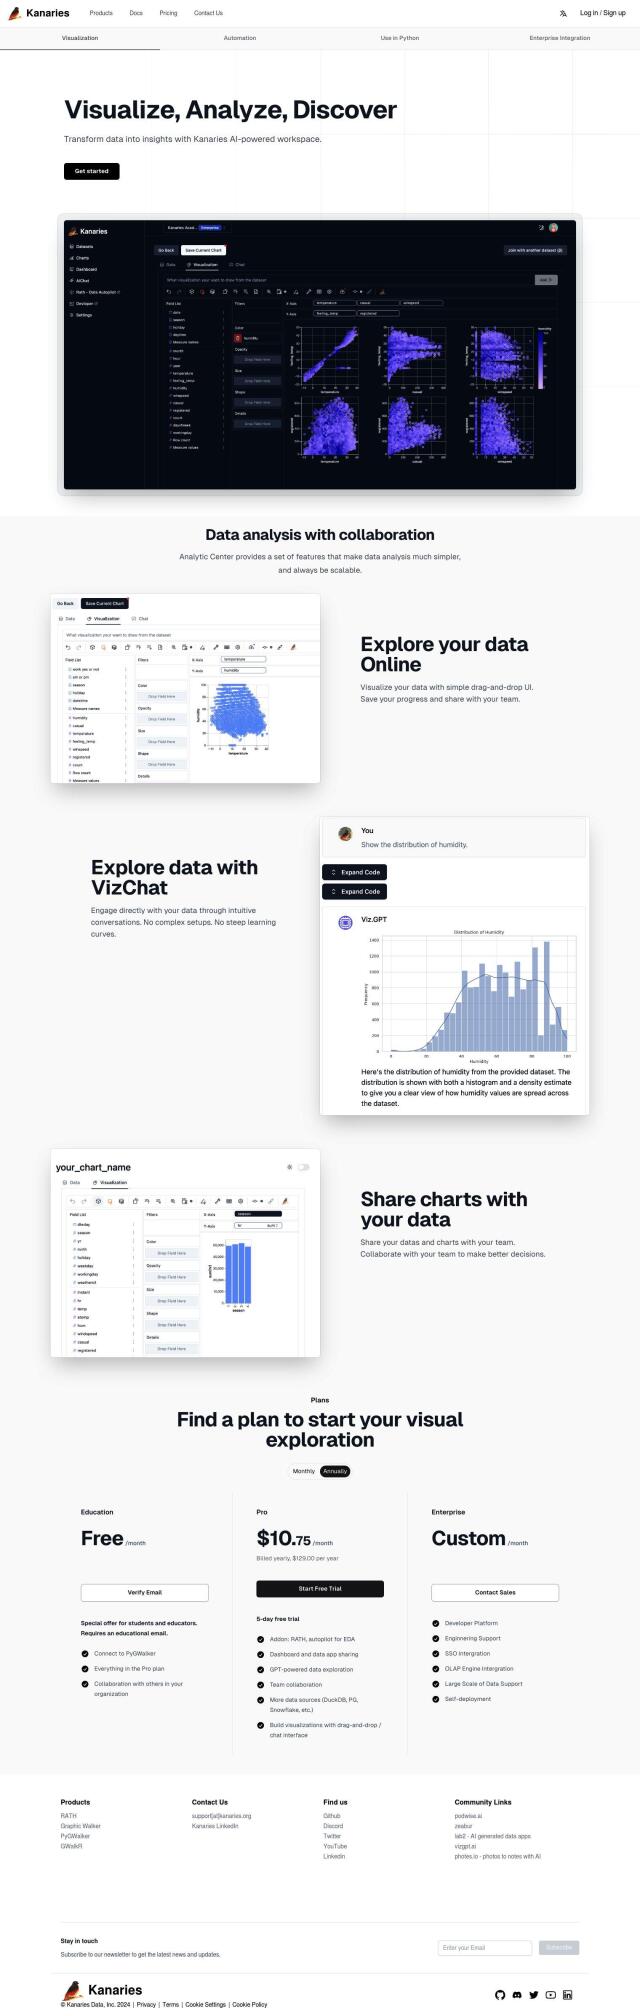
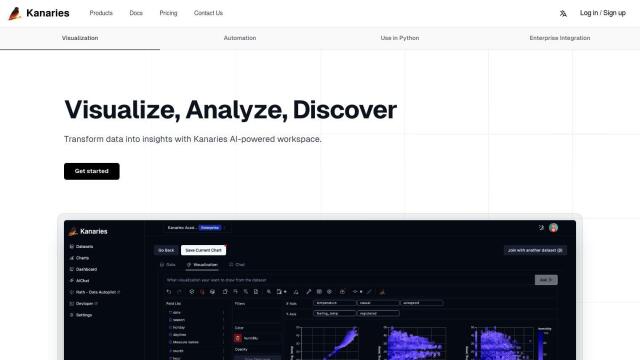
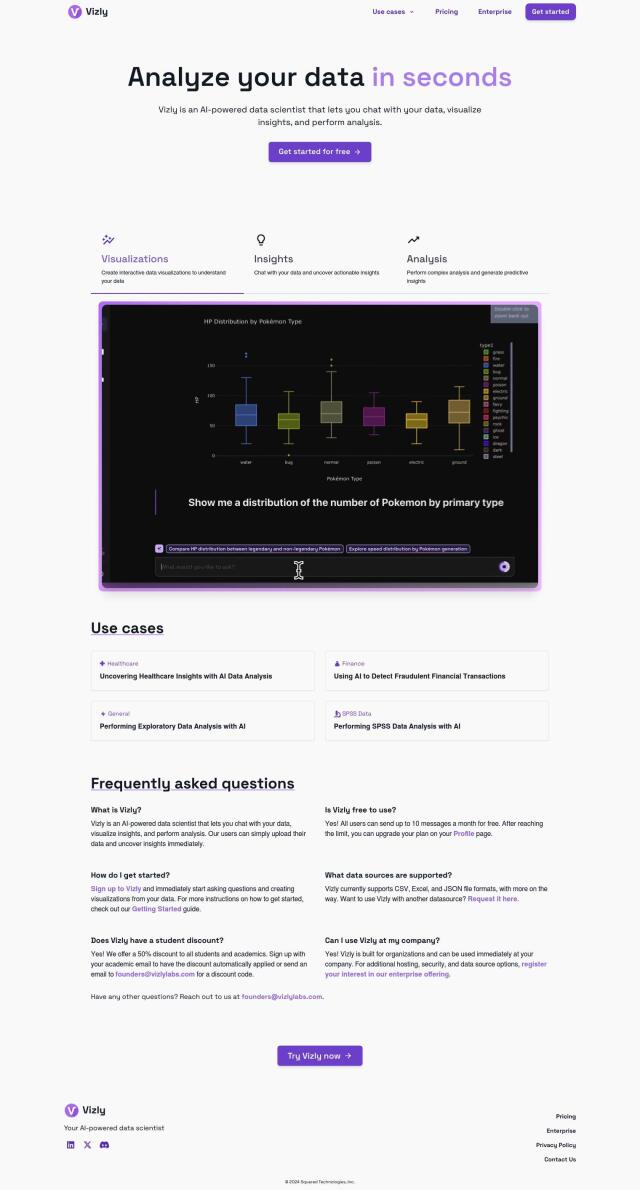
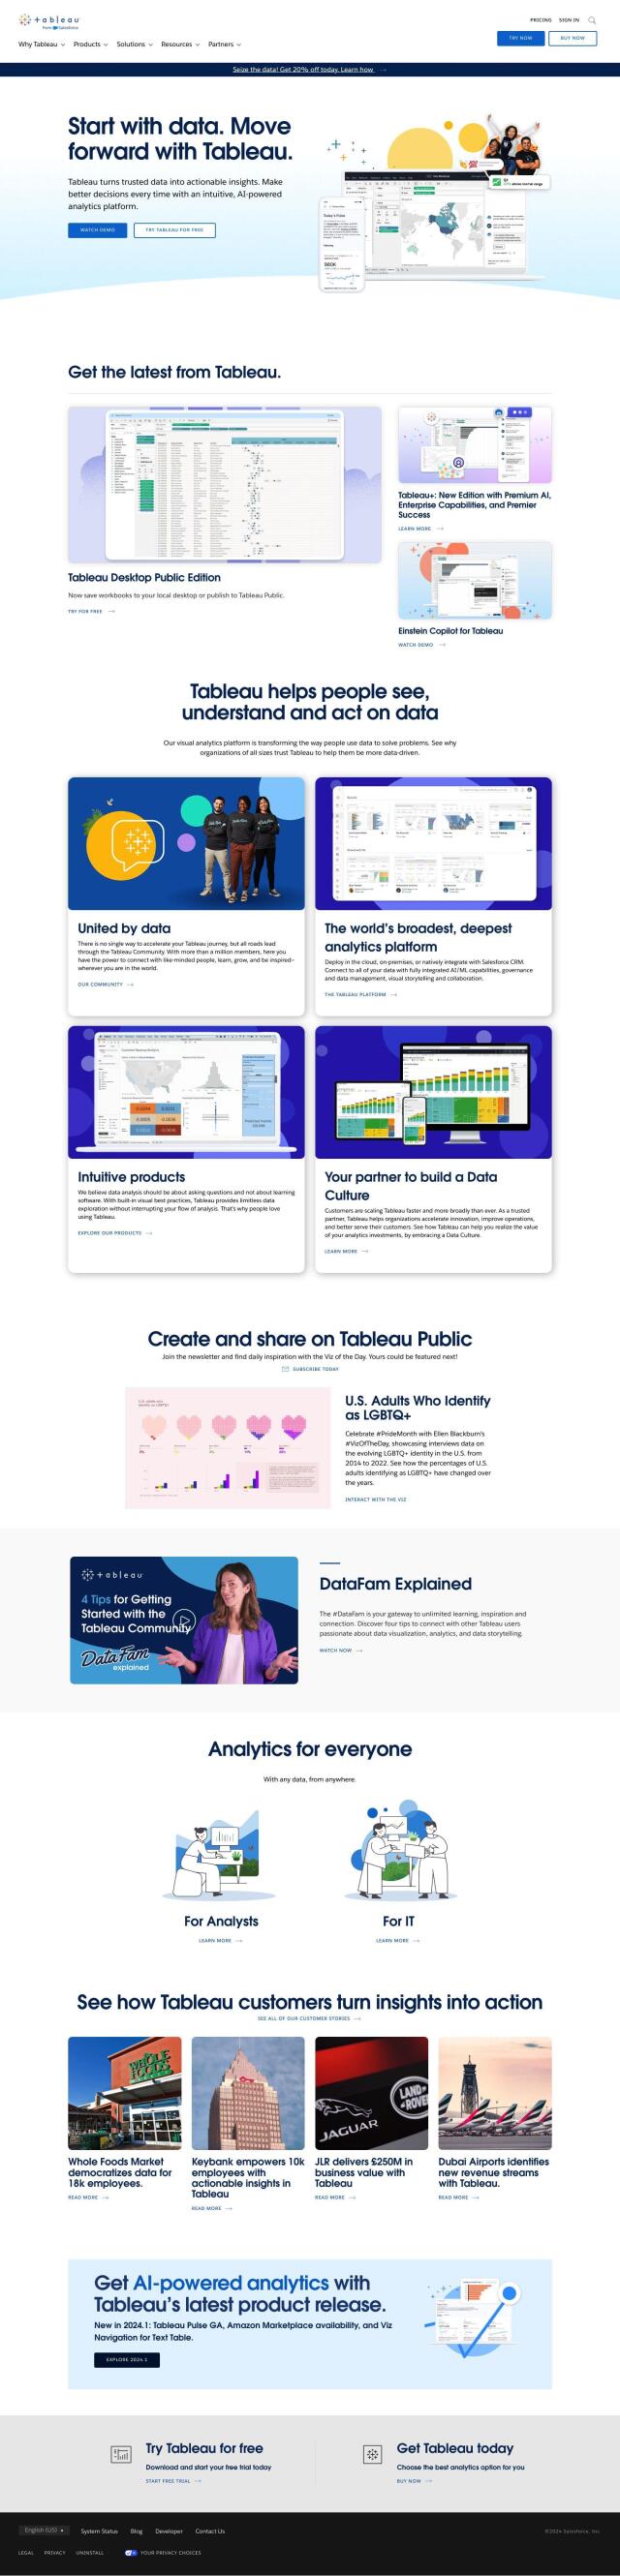
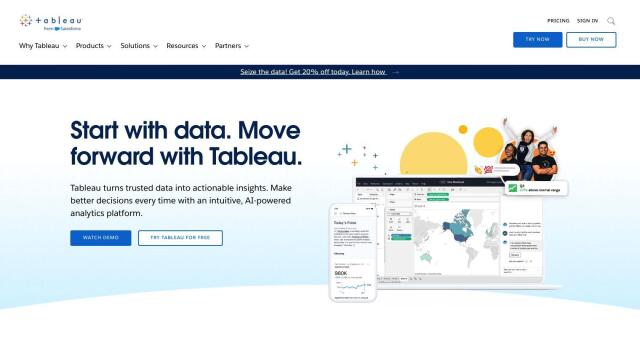
If you need a tool that offers interactivity and visual analytics and real-time insights into big data, Tableau is a top pick. The business intelligence and analytics tool lets people build visualizations with drag-and-drop interfaces and connect to a broad variety of databases. It's got AI/ML abilities, governance and data management tools, and can be deployed in cloud, on-premises and Salesforce CRM environments. Tableau customers include Whole Foods Market and Dubai Airports, and it's helped them with data democratization and insights that lead to action.

Sisense screenshot thumbnail

Sisense

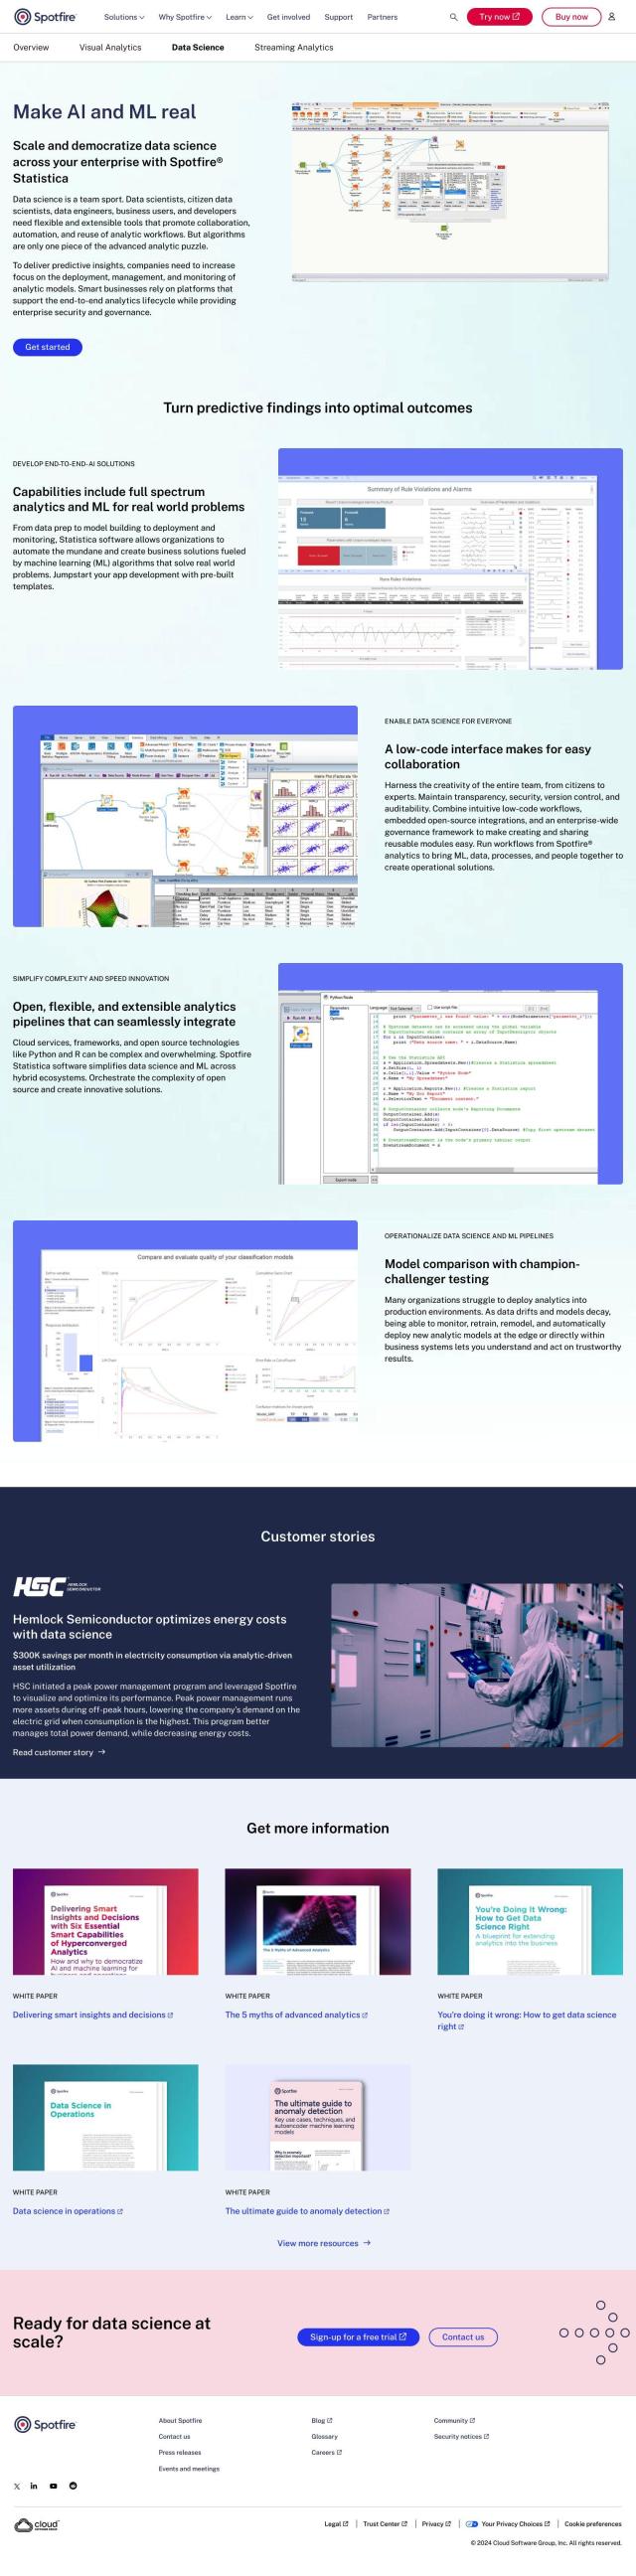
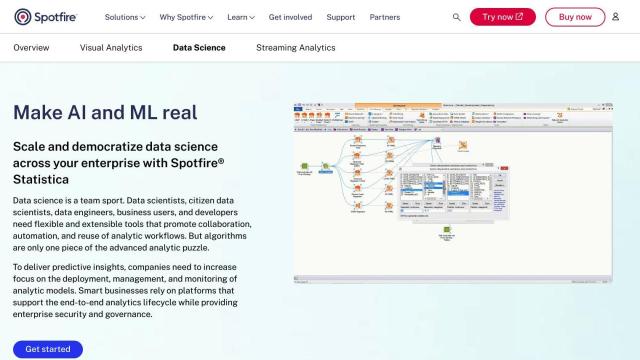
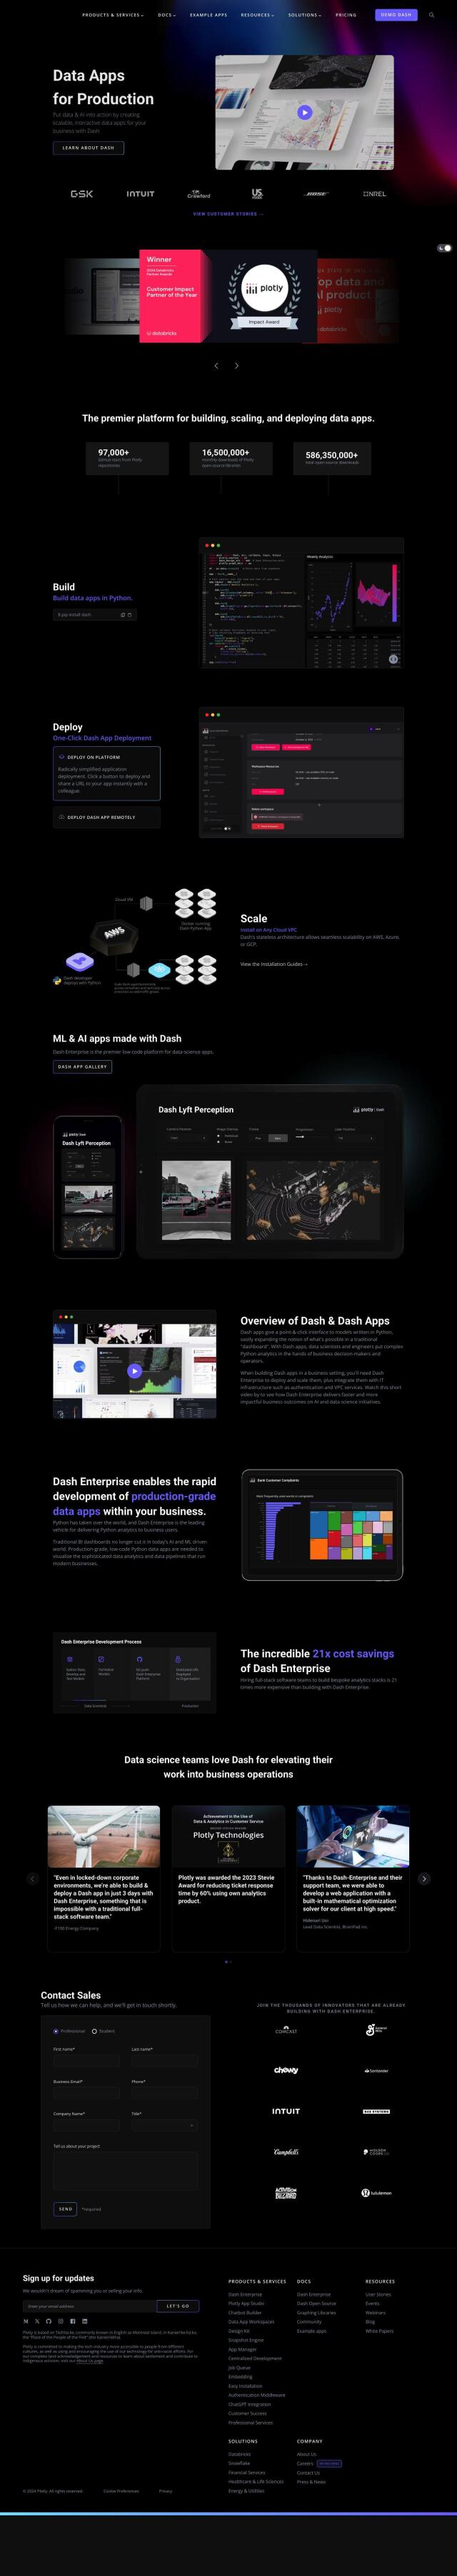
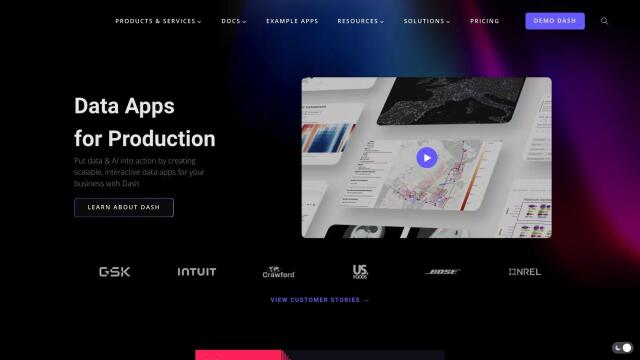
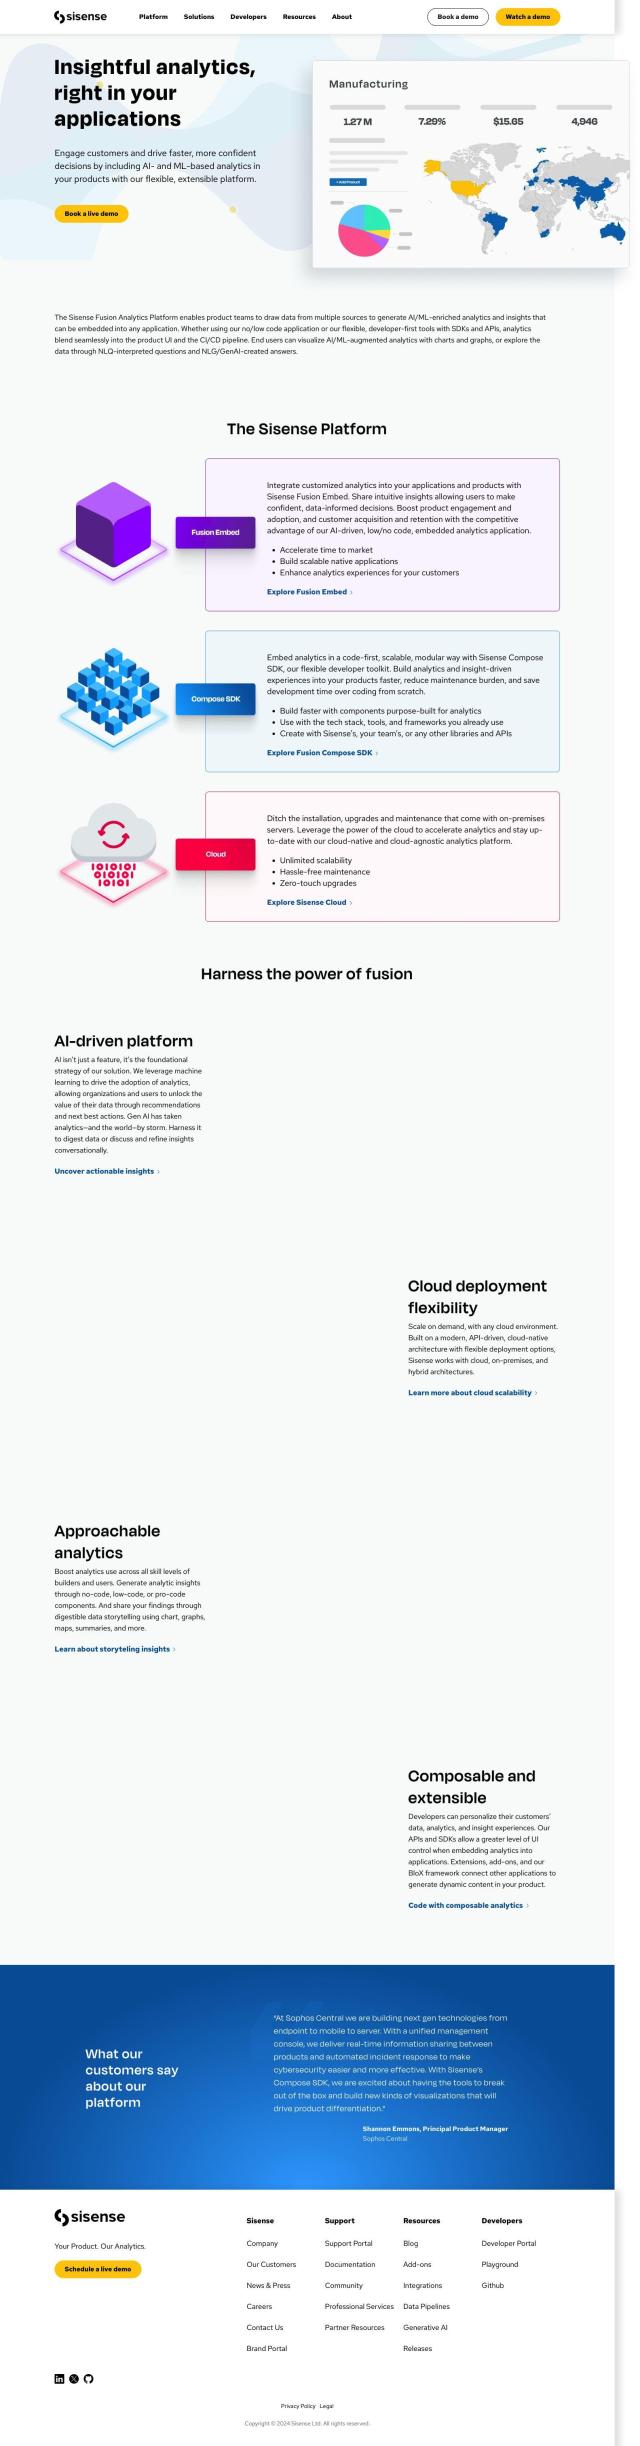
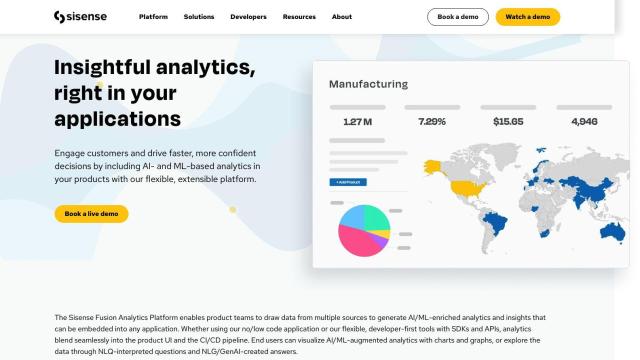
Another top contender is Sisense, an analytics platform that lets customers build AI-infused analytics into their own products and apps. Sisense offers interactive, personalized insights and a broad range of analytics tools, including pro-code, low-code and no-code options. It offers direct data connections, AI and machine learning abilities, secure governance and end-to-end deployment on any cloud. Its flexibility and customizability make it a good foundation for businesses that want to build their own advanced analytics.

HEAVY.AI screenshot thumbnail

HEAVY.AI

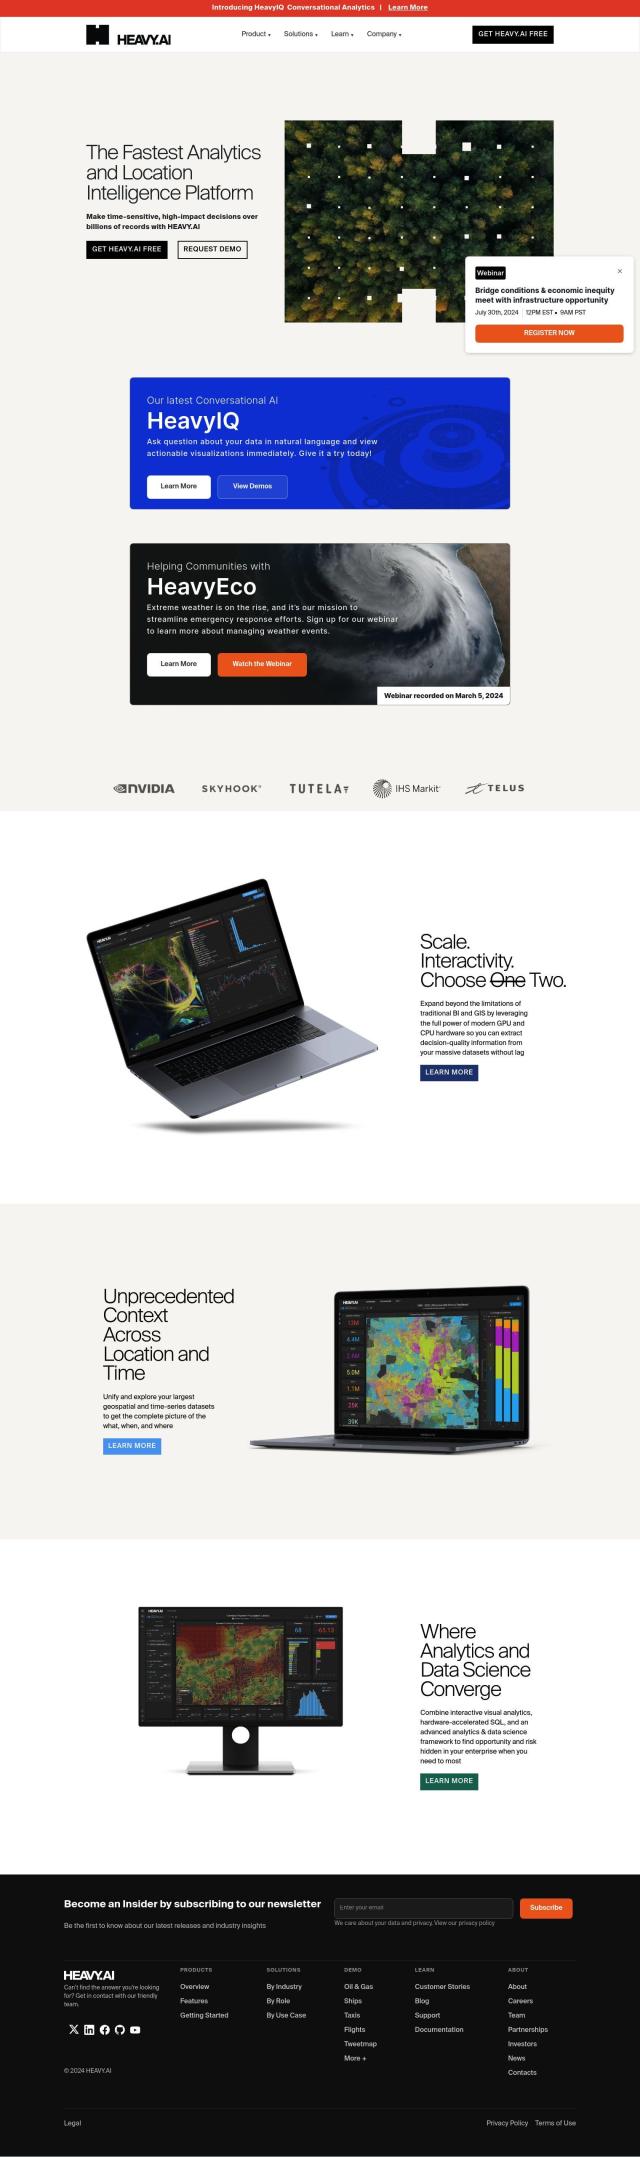
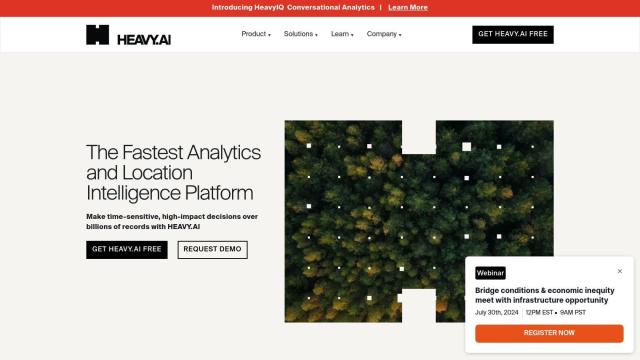
For advanced location and time-based data analytics, HEAVY.AI is a top pick. The company's platform marries hardware-accelerated analytics with interactive visual analytics and a powerful data science framework to get useful information out of massive data sets. It offers Heavy Immerse for interactive visual analytics, HeavyDB for data storage and Heavy Render for server-side visualization. HEAVY.AI customers include oil and gas and government customers, where real-time analytics can help them respond to changing circumstances.
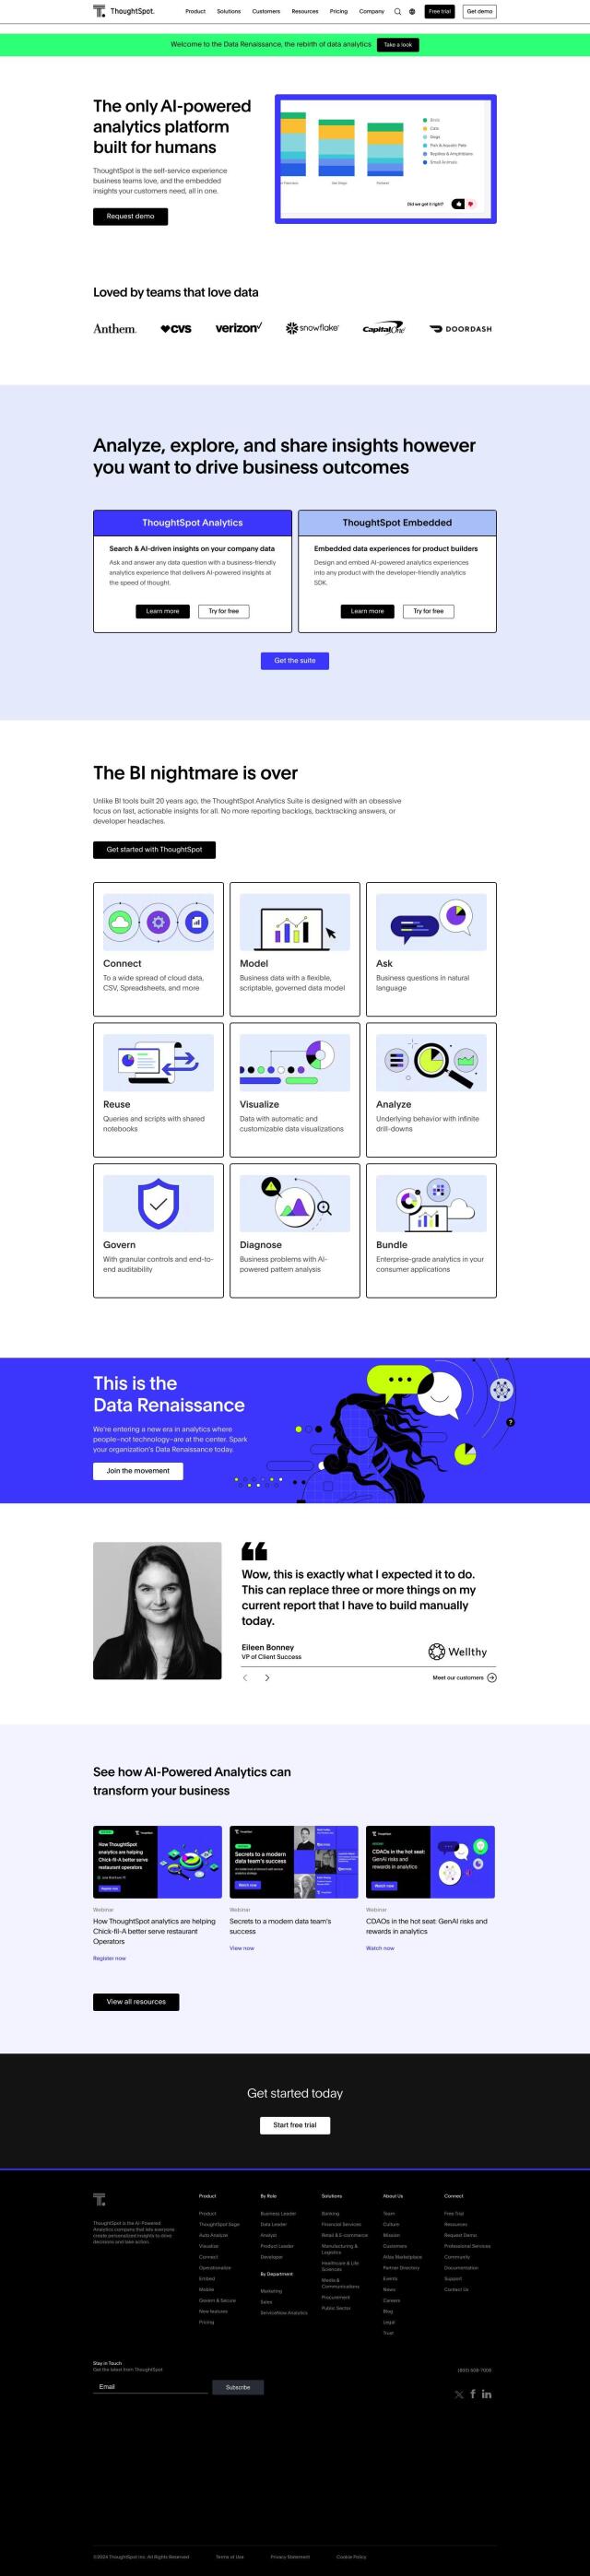
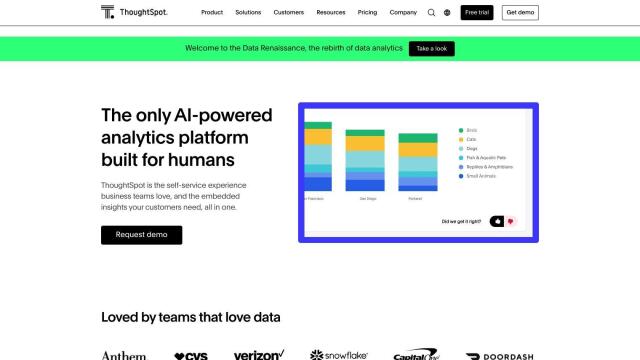
ThoughtSpot screenshot thumbnail

ThoughtSpot

Last, ThoughtSpot is an AI-infused analytics platform that lets people ask complex data questions in natural language and get answers. It offers self-service analytics, natural language queries, flexible data modeling and embedded analytics, so it's good for business teams and product builders. ThoughtSpot is designed to make analytics more accessible, letting people quickly explore, analyze and share insights, and it's used in finance, healthcare and other industries.

Additional AI Projects

Spotfire screenshot thumbnail

Spotfire

Integrate, prepare, analyze, and act on data from multiple sources with a single platform for real-time data exploration and point-and-click data science.

Spotfire screenshot thumbnail

Spotfire

Combines self-service data visualization and advanced data science in a single workflow, empowering users to connect, analyze, and act on data for better business outcomes.

Qlik screenshot thumbnail

Qlik

Unifies data from hundreds of sources into a single fabric, enabling customers to integrate, transform, analyze, and take action on their data for better decisions.

GoodData screenshot thumbnail

GoodData

Quickly build custom data products with interactive analytics abilities, leveraging AI-powered features like a no-code interface and chat assistant for effortless insights.

MicroStrategy screenshot thumbnail

MicroStrategy

Build AI-infused business intelligence apps with rapid integration, cloud-native design, and natural language querying for faster insights and confident decision-making.

Onvo screenshot thumbnail

Onvo

Create interactive charts and insights with simple AI prompts, eliminating the need for complex queries and customizations.

Polymer screenshot thumbnail

Polymer

Converts complex data into intuitive, actionable visualizations, linking multiple sources and generating real-time insights with AI-driven analytics and suggested trends.

Hex screenshot thumbnail

Hex

Unify data teams with AI-assisted exploration, collaboration, and interactive reporting, accelerating data work and improving accuracy in a single, modular workspace.

Tabula screenshot thumbnail

Tabula

Automate data workflows, standardize disparate sources, and gain real-time insights without coding, empowering data-driven decision-making across departments.

DataGPT screenshot thumbnail

DataGPT

Get instant, analyst-level answers to data questions in seconds, with automated insights and visualizations, making complex data analysis accessible to everyone.

Deepnote screenshot thumbnail

Deepnote

Combines Python, SQL, and no-code tools with AI-powered code completion to explore, analyze, and share data, boosting productivity and simplifying analysis.

Canvas screenshot thumbnail

Canvas

Link, query, and visualize data from 150+ SaaS tools without coding, empowering non-technical teams to make data-informed decisions.

Rasgo screenshot thumbnail

Rasgo

Ask plain language questions and get instant, automated insights with 24/7 intelligent analysis, secured and customized with business context and visualizations.

Airbook screenshot thumbnail

Airbook

Accelerate data analysis and insights generation across teams with native connectors to 150+ data sources, collaborative querying, and visualization tools.

Explo screenshot thumbnail

Explo

Embed interactive dashboards and self-serve reporting directly into products, enabling end-users to customize analytics experiences and make better decisions.

Vizzly screenshot thumbnail

Vizzly

Build and share interactive, customizable analytics experiences with a no-code dashboard builder, empowering users to explore data without technical hassle.

Jeda.ai screenshot thumbnail

Jeda.ai

Collaborative, interactive canvas for creating, visualizing, and analyzing data, turning ideas into beautiful visuals and insights with advanced generative AI capabilities.

Kanaries screenshot thumbnail

Kanaries

Explore and analyze data with a drag-and-drop interface, conversational insights, and seamless collaboration and sharing capabilities.

Dash screenshot thumbnail

Dash

Build interactive, data-driven applications with Python, deploying and sharing with a single click, and scaling on any cloud infrastructure.

Vizly screenshot thumbnail

Vizly

Interactively analyze data by asking questions, visualizing results, and performing advanced analysis to uncover insights and predictions.