Question: I need a solution that enables interactive reporting and dashboard creation with drag-and-drop functionality.
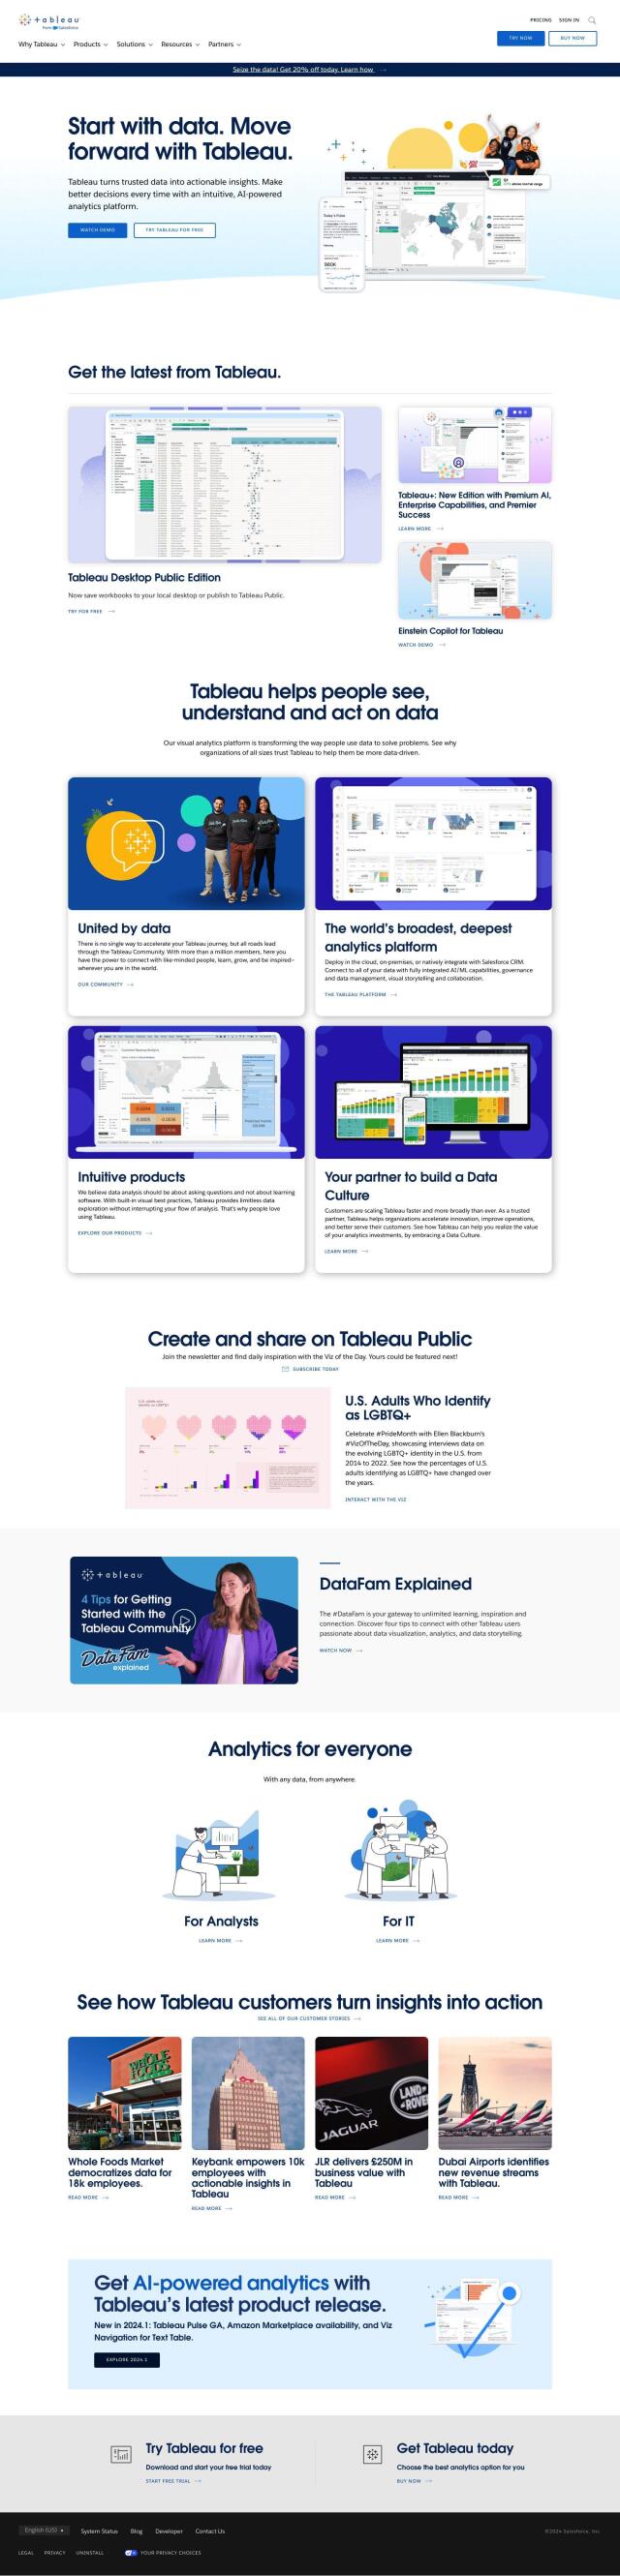
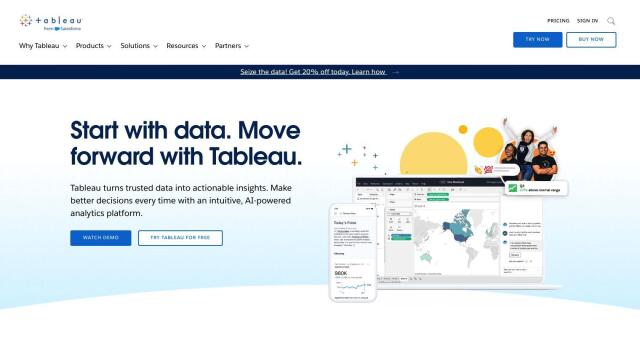
Tableau screenshot thumbnail

Tableau

If you want a product that lets you build interactive reports and dashboards with drag-and-drop interfaces, Tableau is a top candidate. Tableau is a business intelligence and analytics tool that lets people build visualizations through drag-and-drop interfaces. It can connect to a broad range of databases, and it's got features like AI/ML abilities, governance and collaboration tools, so it's a good fit for teams and businesses. Tableau has different editions and a free trial, so it's available and adaptable for different needs.
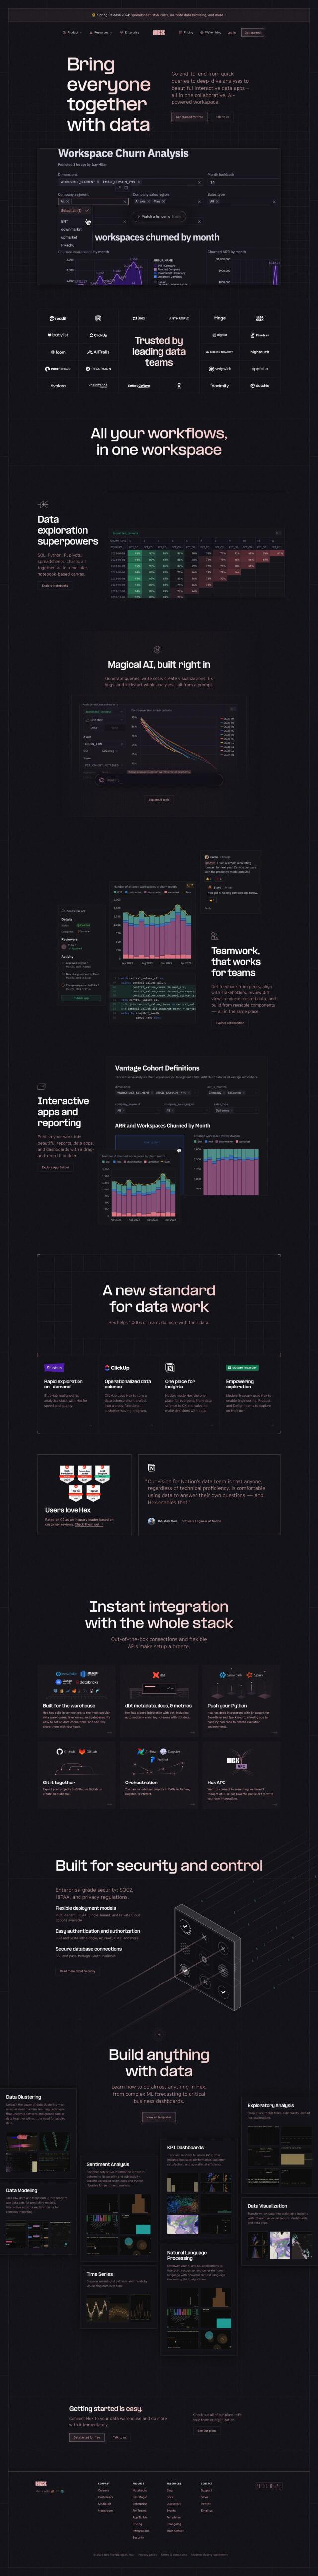
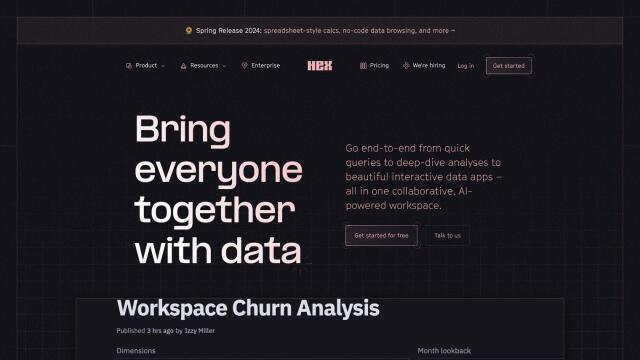
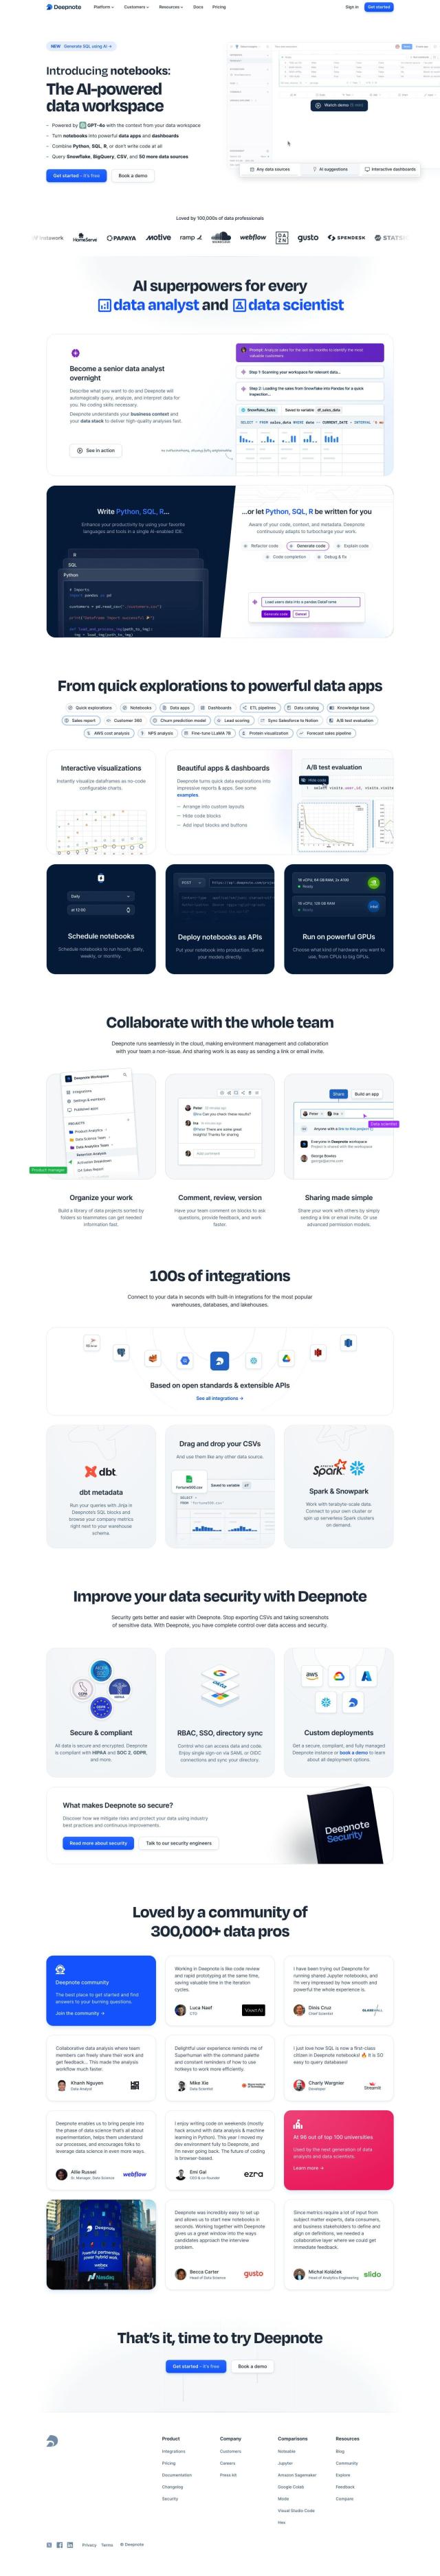
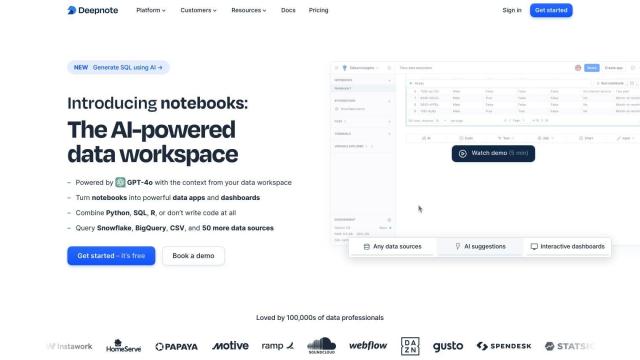
Hex screenshot thumbnail

Hex

Another contender is Hex, an AI-augmented collaborative workspace that streamlines data analysis and visualization. Hex offers drag-and-drop reports, data apps and dashboards, as well as connections to common data warehouses. It supports more-advanced techniques like data clustering and sentiment analysis, and it's got enterprise-grade security with SOC2 and HIPAA compliance. Hex has tiered pricing and a 14-day free trial, so it's a good option for data teams.
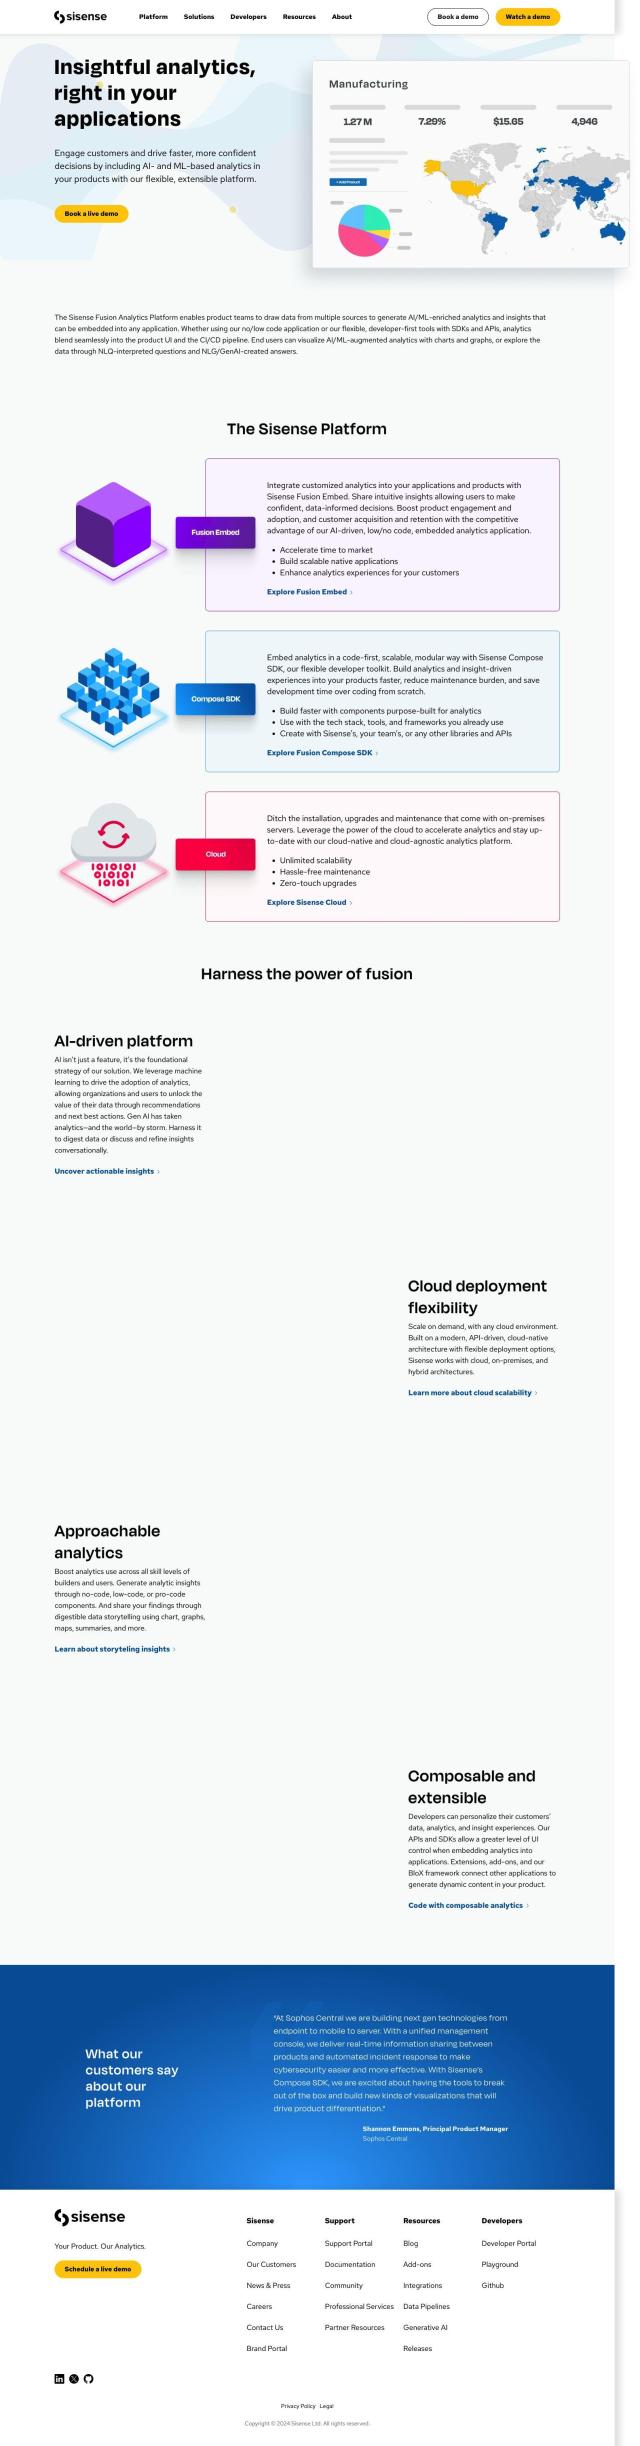
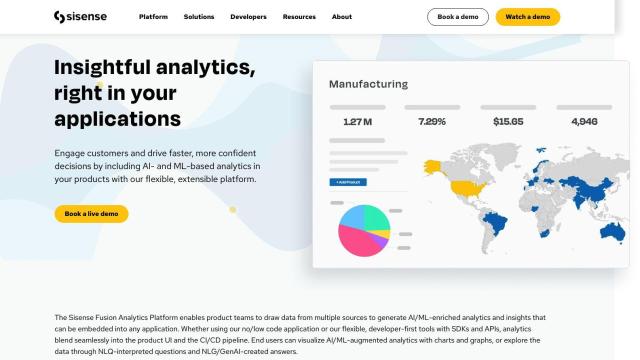
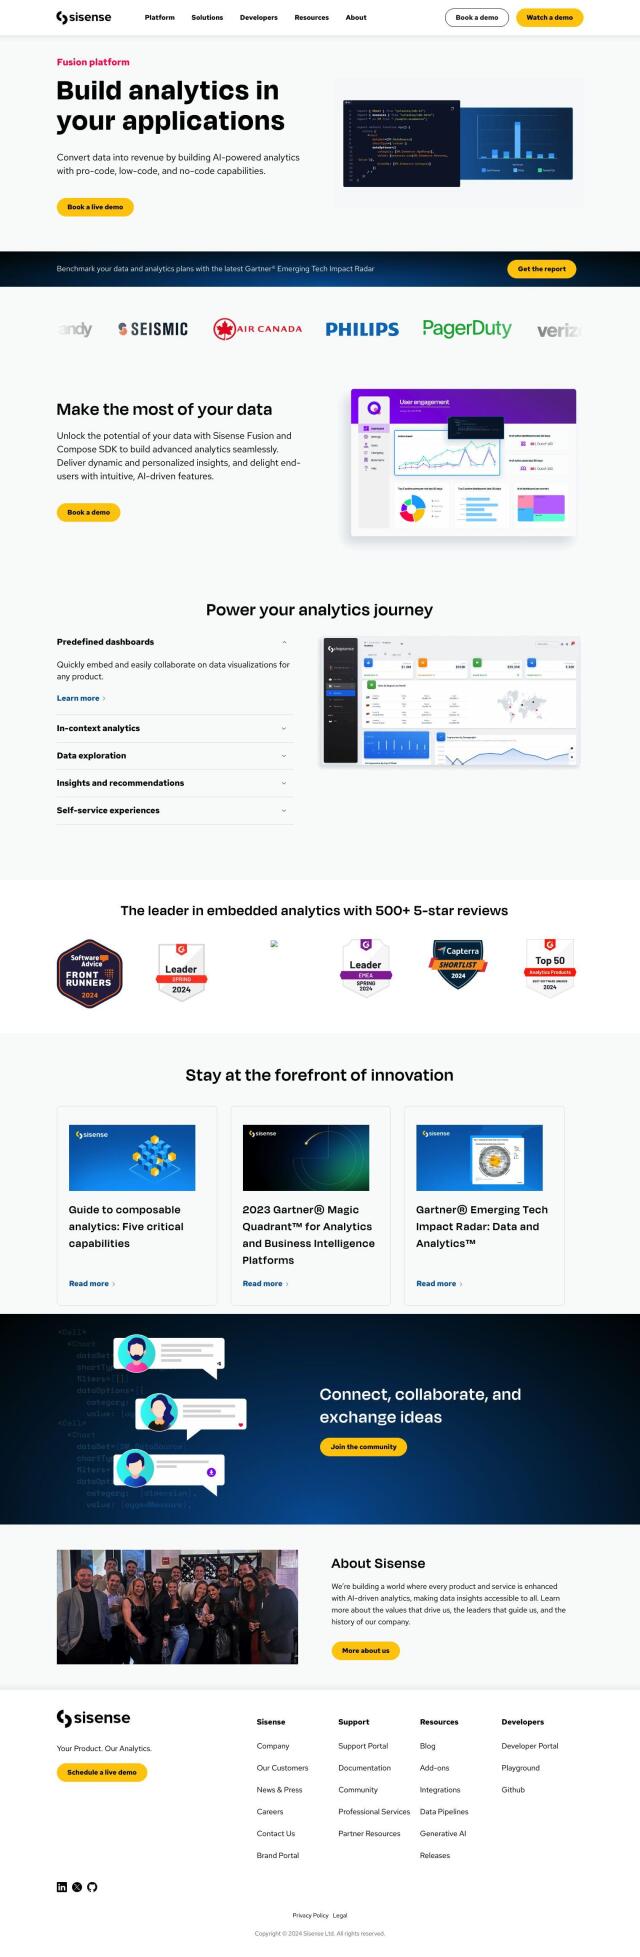
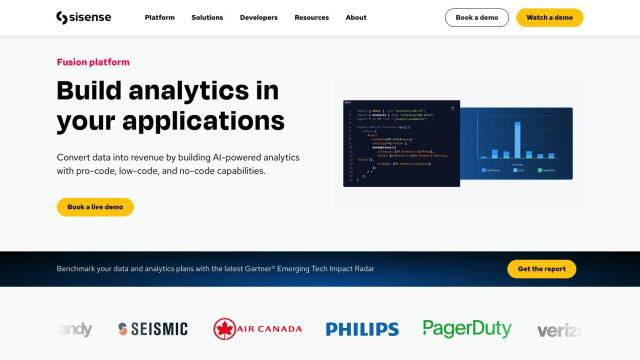
Sisense screenshot thumbnail

Sisense

If you need a platform that's highly customizable, Sisense offers a variety of tools to build AI-infused analytics into their products. Sisense lets end-users get interactive, personalized insights, but it also offers pro-code, low-code and no-code options for more advanced analytics. It also offers drag-and-drop interfaces for data visualization, so you can build custom dashboards and share insights. Sisense pricing is customizable to suit your needs, so it's good for businesses and developers.
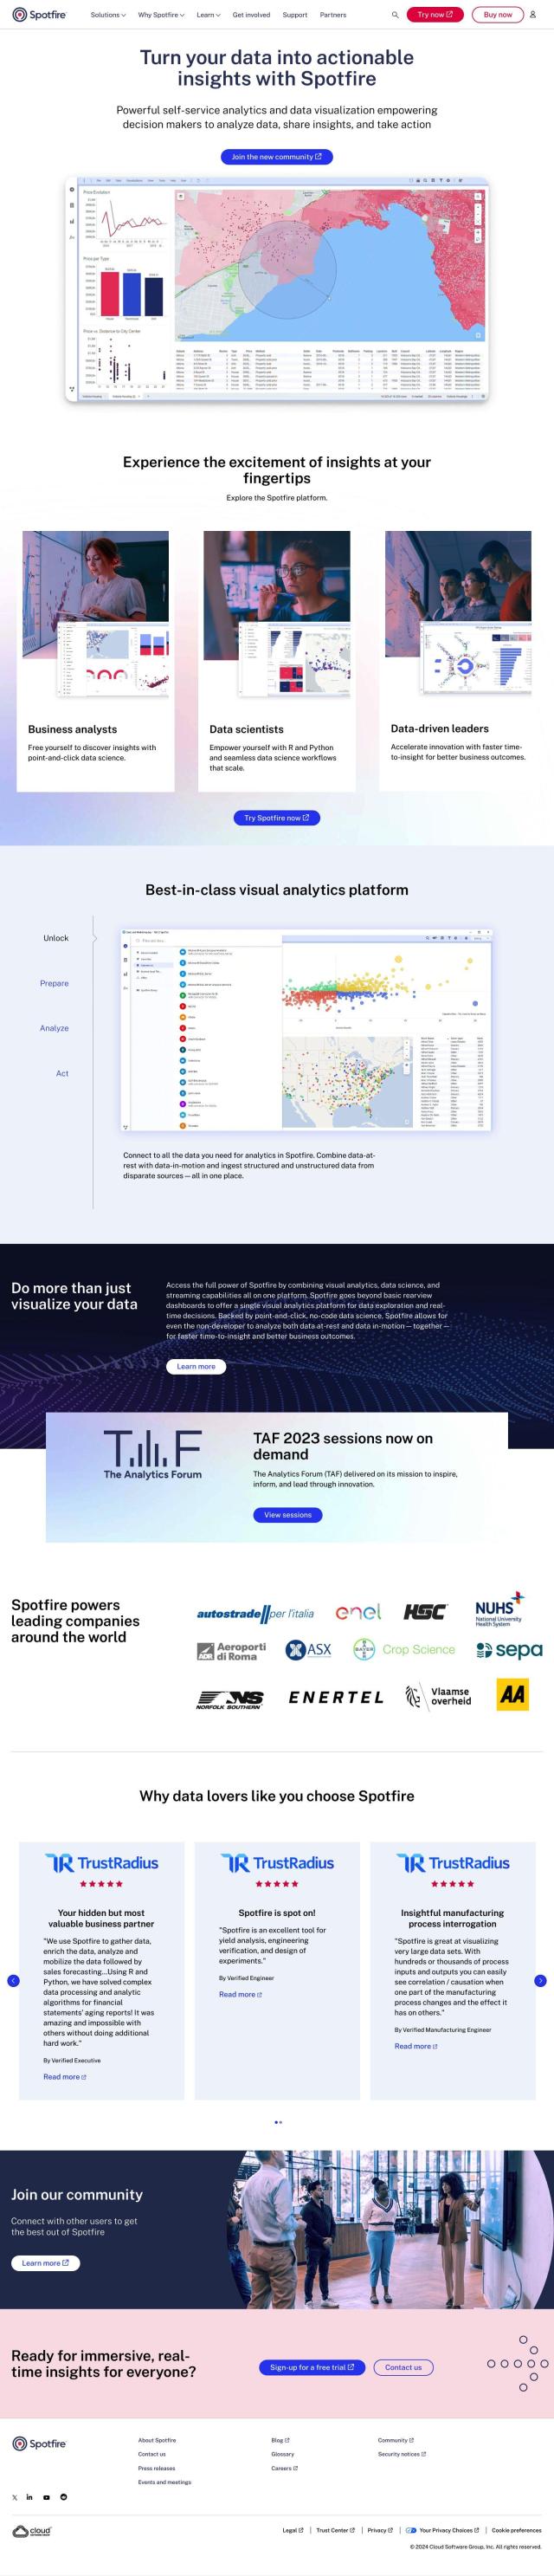
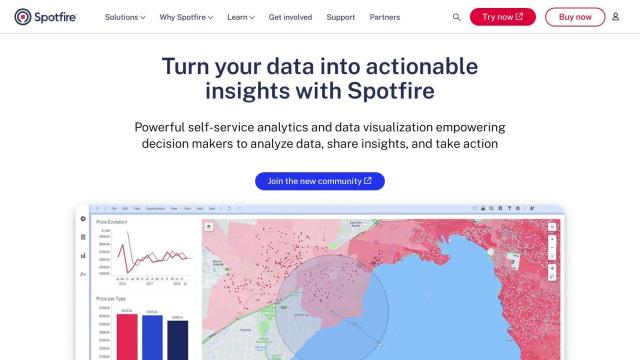
Spotfire screenshot thumbnail

Spotfire

Last, Spotfire is another powerful visual analytics tool that lets organizations combine, analyze and act on data. It offers drag-and-drop and no-code data science tools so people can explore and model data for insights. Spotfire supports hybrid deployment and can consume structured and unstructured data, so it's a good fit for many industries. And it's got a free trial option so you can try it out.

Additional AI Projects

ThoughtSpot screenshot thumbnail

ThoughtSpot

Ask complex data questions in natural language and get instant AI-powered insights, empowering informed business decisions without requiring SQL or data expertise.

Qlik screenshot thumbnail

Qlik

Unifies data from hundreds of sources into a single fabric, enabling customers to integrate, transform, analyze, and take action on their data for better decisions.

Domo screenshot thumbnail

Domo

Unifies data from any source, providing AI-driven insights and automation to drive real-time decisions and meaningful actions across the organization.

Sisense screenshot thumbnail

Sisense

Embed advanced analytics into apps with pro-code, low-code, and no-code abilities, unlocking data potential and driving revenue with personalized, AI-powered insights.

GoodData screenshot thumbnail

GoodData

Quickly build custom data products with interactive analytics abilities, leveraging AI-powered features like a no-code interface and chat assistant for effortless insights.

datapine (RIB BI+) screenshot thumbnail

datapine (RIB BI+)

Empower data-driven decision-making with self-service analytics, combining data from multiple sources into a single, secure point of truth.

Polymer screenshot thumbnail

Polymer

Converts complex data into intuitive, actionable visualizations, linking multiple sources and generating real-time insights with AI-driven analytics and suggested trends.

Onvo screenshot thumbnail

Onvo

Create interactive charts and insights with simple AI prompts, eliminating the need for complex queries and customizations.

Mode screenshot thumbnail

Mode

Unify data analysis and visualization with SQL, R, Python, and interactive dashboards to accelerate insights and collaboration across teams.

Graphy screenshot thumbnail

Graphy

Combine data from multiple sources into interactive, shareable reports in minutes, with AI-powered tools reducing creation time by 80%.

Explo screenshot thumbnail

Explo

Embed interactive dashboards and self-serve reporting directly into products, enabling end-users to customize analytics experiences and make better decisions.

Vizzly screenshot thumbnail

Vizzly

Build and share interactive, customizable analytics experiences with a no-code dashboard builder, empowering users to explore data without technical hassle.

Deepnote screenshot thumbnail

Deepnote

Combines Python, SQL, and no-code tools with AI-powered code completion to explore, analyze, and share data, boosting productivity and simplifying analysis.

Breadcrumb screenshot thumbnail

Breadcrumb

Transform data into interactive AI dashboards, connecting multiple sources, and track trends in real-time with 100% accurate visualizations and natural language queries.

Tabula screenshot thumbnail

Tabula

Automate data workflows, standardize disparate sources, and gain real-time insights without coding, empowering data-driven decision-making across departments.

Airbook screenshot thumbnail

Airbook

Accelerate data analysis and insights generation across teams with native connectors to 150+ data sources, collaborative querying, and visualization tools.

DataChat screenshot thumbnail

DataChat

Access complex data insights without coding, using a familiar chat and spreadsheet interface to generate transparent, reproducible results.

Canvas screenshot thumbnail

Canvas

Link, query, and visualize data from 150+ SaaS tools without coding, empowering non-technical teams to make data-informed decisions.

Dataiku screenshot thumbnail

Dataiku

Systemize data use for exceptional business results with a range of features supporting Generative AI, data preparation, machine learning, MLOps, collaboration, and governance.

Rasgo screenshot thumbnail

Rasgo

Ask plain language questions and get instant, automated insights with 24/7 intelligent analysis, secured and customized with business context and visualizations.