Question: How can I get a detailed view of my application's service interdependencies and pinpoint root cause analysis for performance problems?

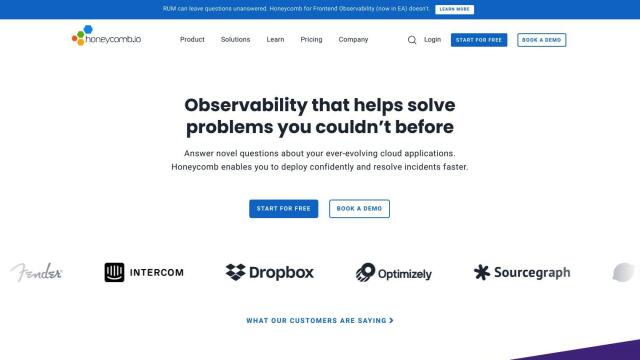
Honeycomb
If you want to see a detailed map of your app's service interdependencies and to drill down to the root cause of performance problems, Honeycomb is a good choice. This observability platform lets teams quickly zero in on the source of problems in distributed services. It offers features like distributed tracing, smart data sampling and debuggable Service Level Objectives (SLOs). Honeycomb also integrates with Slack and supports OpenTelemetry, giving you a good foundation for monitoring and triaging problems.
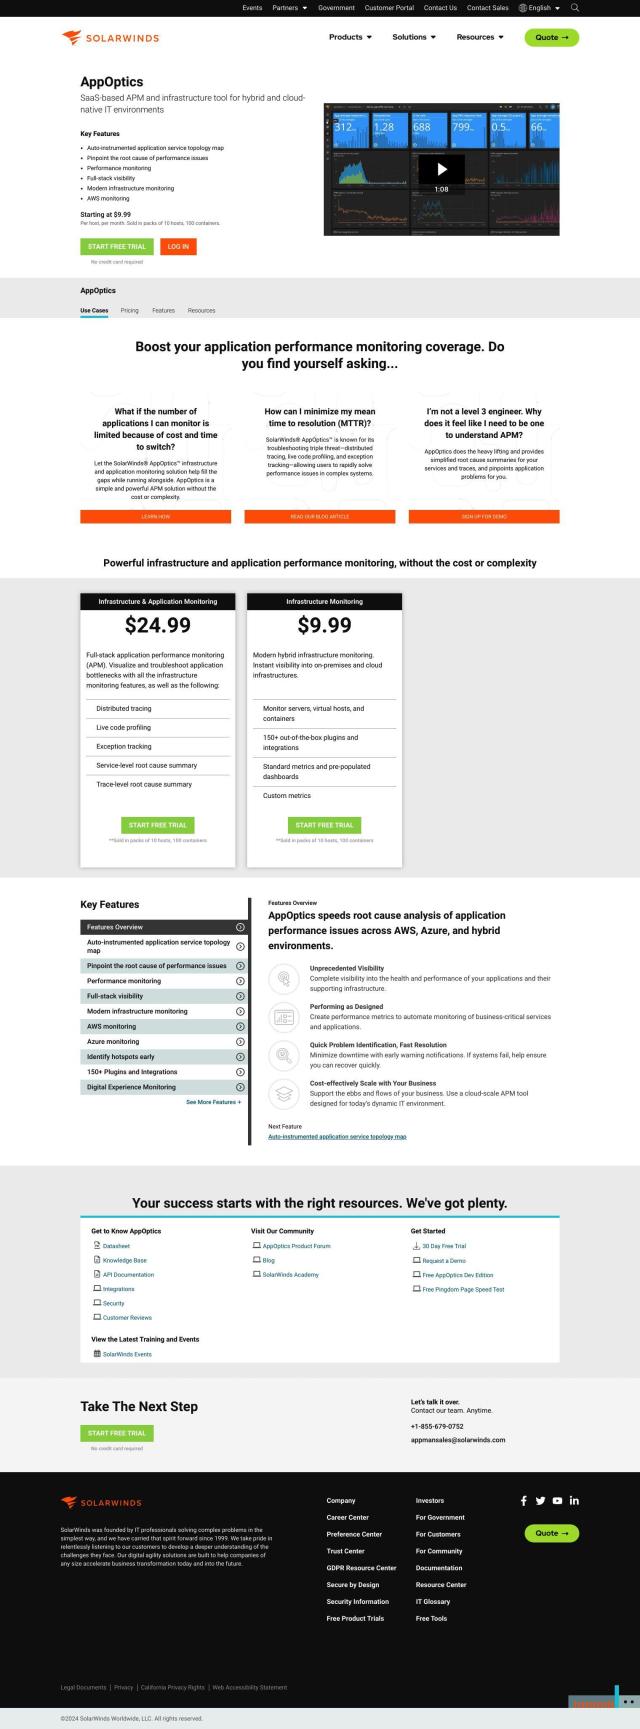
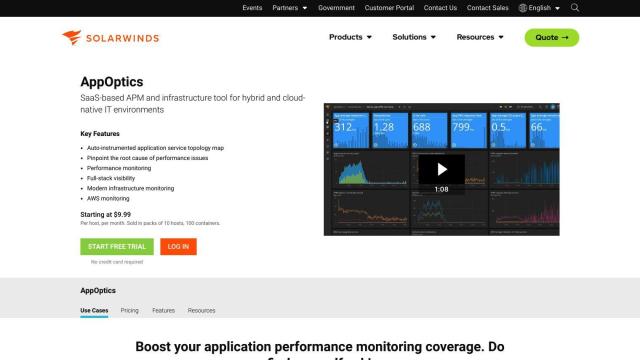
AppOptics
Another good option is AppOptics, a SaaS-based application performance monitoring (APM) and infrastructure tool. It offers a broad view of modern app and infrastructure performance through prebuilt dashboards, metrics and analytics. AppOptics also offers an auto-instrumented application service topology map, root cause analysis and live code profiling, so it's a good choice if you have a big app and infrastructure to monitor.
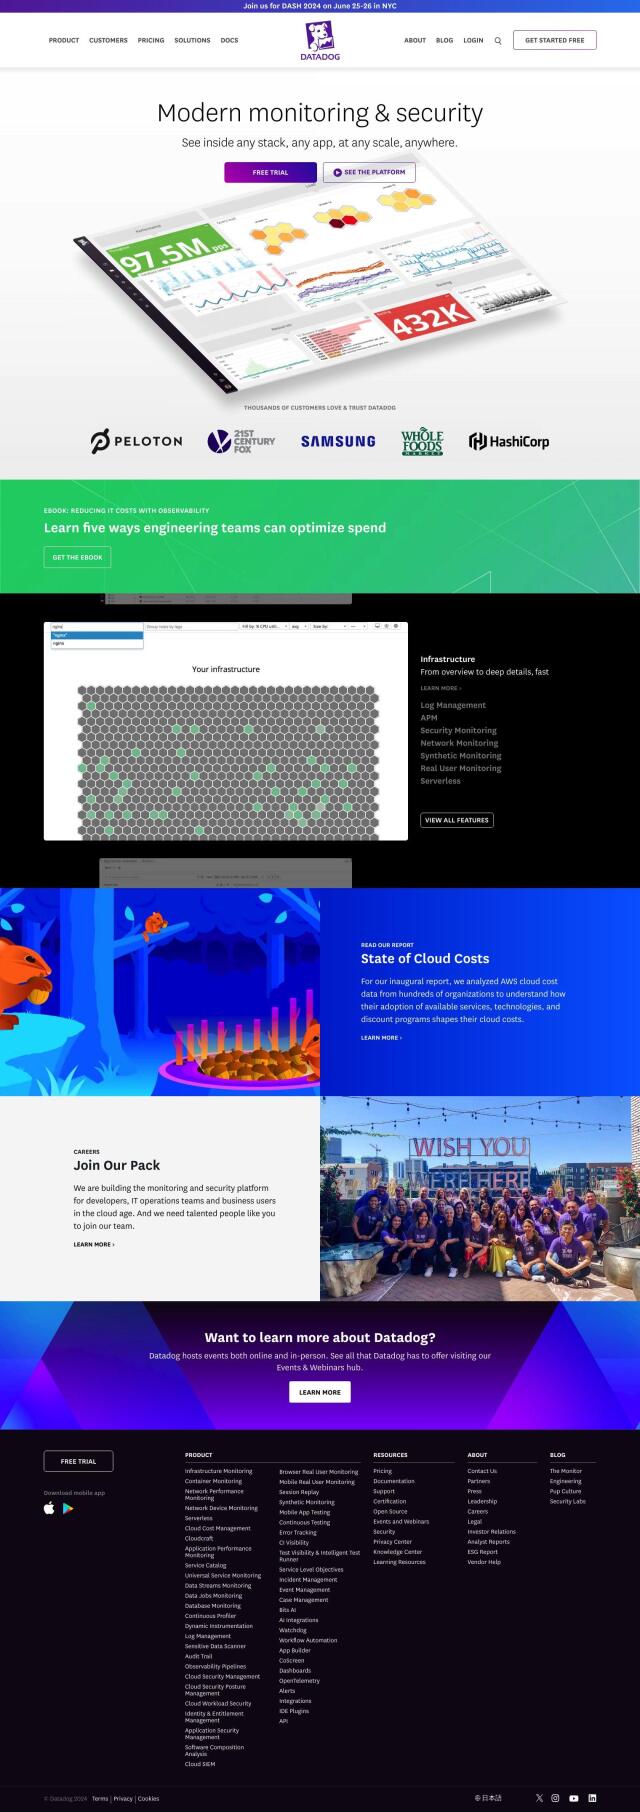
Datadog
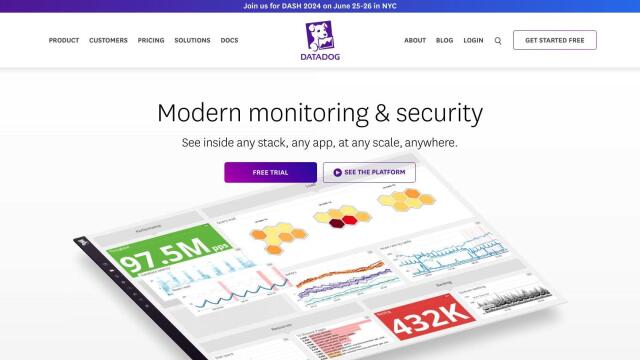
Datadog is another good option, offering real-time insights into performance, security and user experience. It offers a range of features, including infrastructure monitoring, APM, synthetic monitoring and serverless monitoring. Datadog's broad monitoring abilities let you quickly spot and fix problems, and it's a good general-purpose tool for maximizing system performance and reliability.

BigPanda
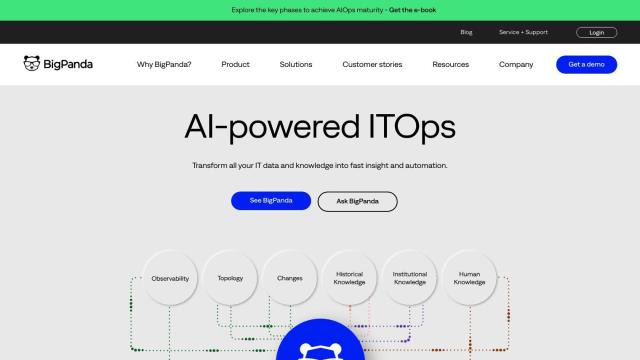
If you want an AI-infused approach, BigPanda offers multidimensional correlation, automated root cause analysis and unified analytics dashboards. It can integrate with a variety of monitoring and observability tools to help you maximize service availability and improve IT operations by correlating and enriching alert data. BigPanda's generative AI abilities also make it a good choice for real-time incident analysis and resolution.

