Question: Can you recommend a data analytics platform that allows non-technical users to easily build custom dashboards and charts?

Tableau
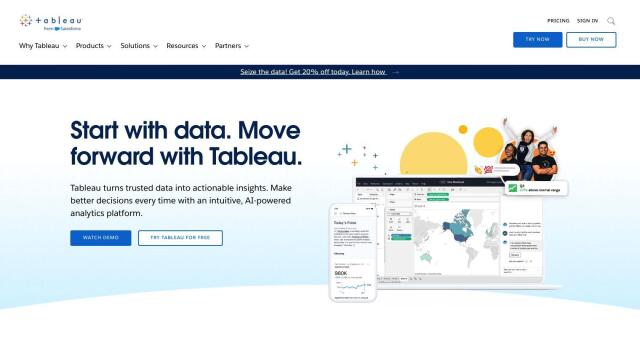
If you're looking for a data analytics platform that lets non-technical people build custom dashboards and charts, Tableau is a top option. Tableau is a business intelligence and analytics platform that connects to a variety of databases and lets people create visualizations through drag-and-drop interfaces. It can be used in the cloud, on-premises or in Salesforce CRM, and includes AI/ML abilities, governance and data management, visual storytelling and collaboration tools.

Sisense
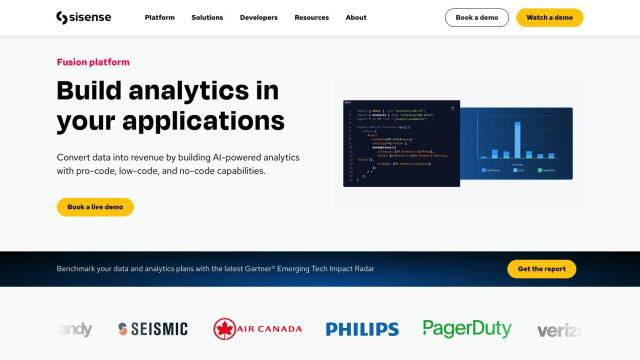
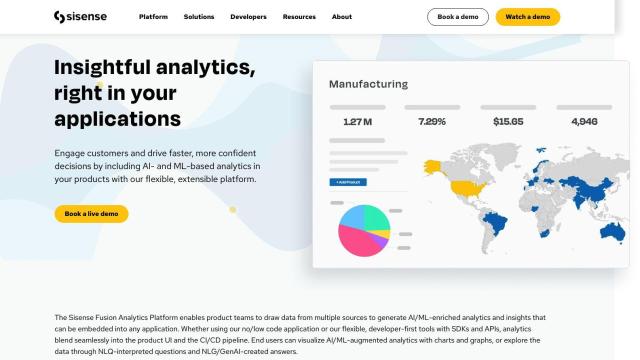
Another top option is Sisense, which offers a variety of tools and abilities for building AI-infused analytics. It offers pro-code, low-code and no-code abilities for advanced analytics, along with direct data connections to many sources and interactive visualizations. Sisense also offers data visualization with drag-and-drop interfaces and developer tools for building analytics with Git, so it can be used in a variety of deployment scenarios.

GoodData
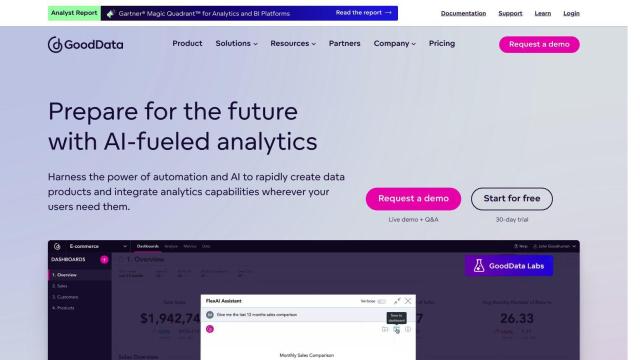
GoodData is another option. It's got a no-code user interface and an AI Chat Assistant, so you can quickly create customized data products with interactive analytics. It also has customizable analytics, scalability, code-based developer tools and an interface that's easy to use, so it's good for both data analysts and data consumers. You can try it with a 30-day free trial and set custom pricing by contacting the company.

Polymer
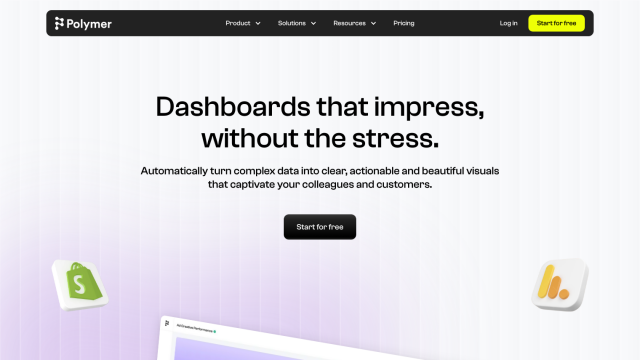
If you're looking for a focus on real-time insights and ease of use, take a look at Polymer. This AI-powered dashboard creation platform turns complex data into insights and integrates multiple data sources easily. It's got more than 20 data connectors, real-time insights and pre-built templates for different use cases, so non-technical people can analyze and visualize data.

