Question: Can you suggest a platform that allows me to create custom data visualizations and charts without requiring extensive coding knowledge?

Tableau
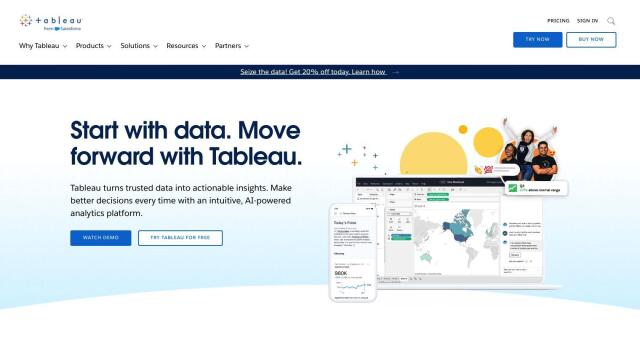
If you want a tool to create custom data visualizations and charts without having to know how to program, Tableau is a top contender. It's got a drag-and-drop interface that makes it easy to create visualizations and share them with others. With AI/ML abilities and multiple deployment options, Tableau is easy to use and flexible, good for individuals and teams.

Onvo
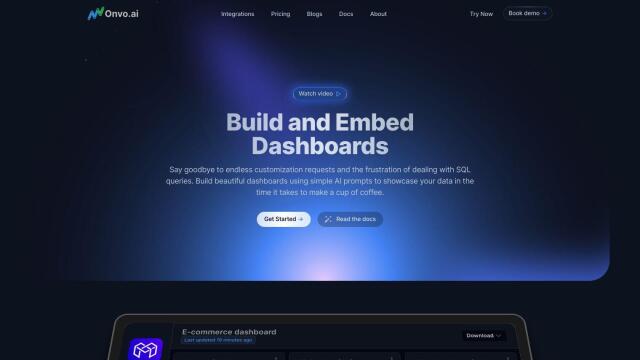
Another top contender is Onvo, an AI-infused tool that lets you create interactive charts and dashboards without having to fiddle with data. Onvo can handle a variety of data sources and lets you customize the look and feel to match your brand. It's good for startups and enterprises that want to automate workflows and create compelling visualizations.


DataChat
For a no-code tool with AI-infused insights, check out DataChat. It's got the look and feel of a spreadsheet and chat interface you're already familiar with, and you can use it to analyze data without ever writing a line of code. It automates data prep and offers machine learning and predictive analytics, so it's good for data scientists, analysts and business users.
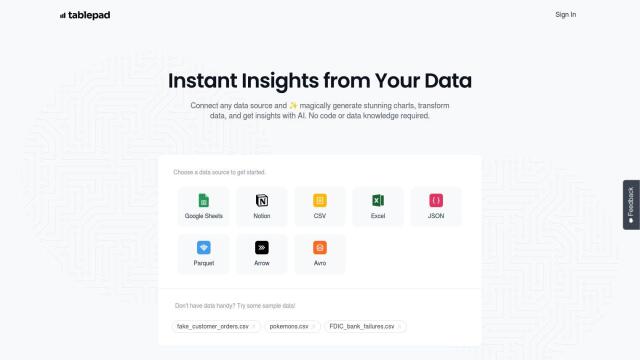
Tablepad
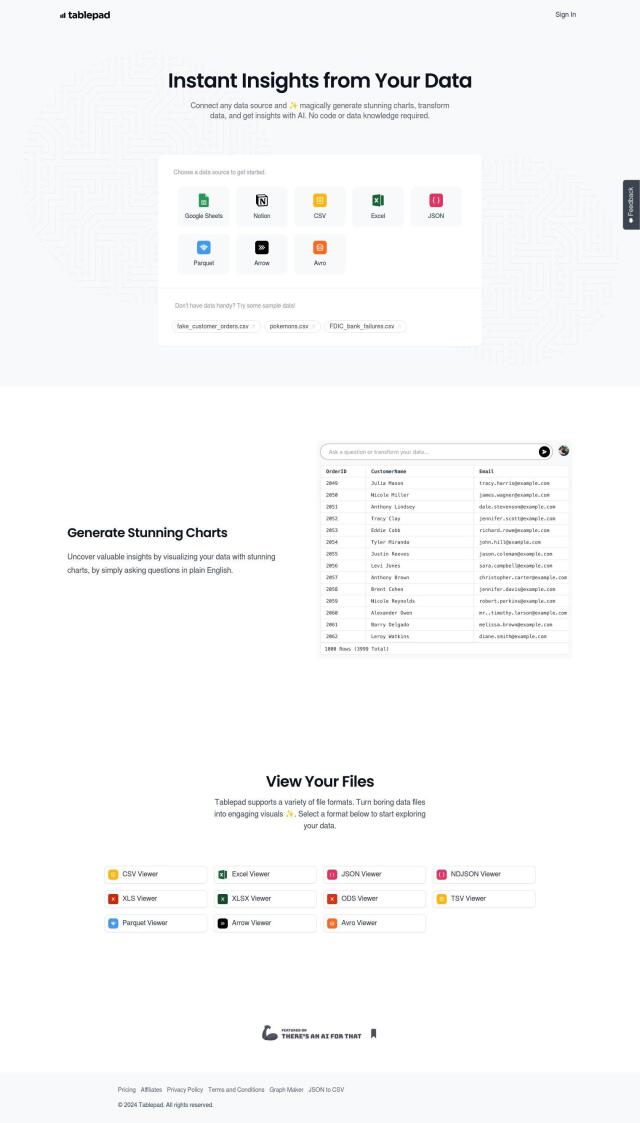
Last, Tablepad is an AI-infused data visualization tool that can connect to multiple data sources and offer a variety of chart types. It's got sample data sets and a range of pricing options, so it should be accessible to people with modest needs. Tablepad is designed to help people get insights by presenting their data in an interactive, easy-to-understand form.

