Question: I'm looking for a tool that allows me to create custom visualizations and automate reports using Python libraries like plotly and matplotlib in Google Sheets.

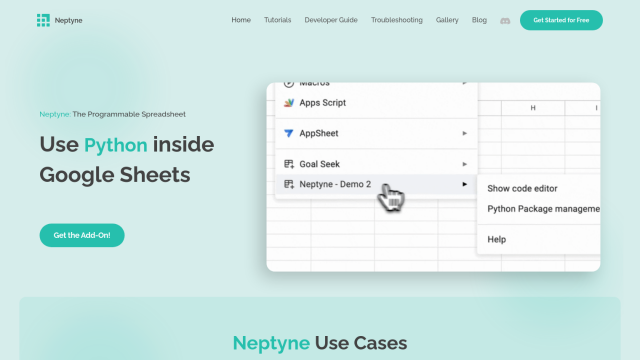
Neptyne
If you want a tool that lets you write your own custom visualizations and automate reports with Python libraries like plotly and matplotlib in Google Sheets, Neptyne is a top choice. Neptyne marries Python code with Google Sheets to do all sorts of data processing and analysis tasks. It can import data from various sources, integrate with Google Analytics, and perform more advanced data processing like anomaly detection and time series forecasting. Neptyne also can use plotly and matplotlib for visualization and automate reports, emails and notifications, all customizable to your needs.

Mito
Another strong contender is Mito, a Python automation tool that creates its own code based on changes to your spreadsheet. It can handle data transformation, visualization and pivot tables in a Jupyter, Streamlit or Dash environment. Mito can integrate with popular data science tools and offer interactive dashboards, too, so it's a good choice for automating your own spreadsheets.

Athena
If you want a more integrated data analysis and automation tool, check out Athena. This AI-native analytics platform offers collaborative data analysis with easy integration into Enterprise Data Warehouses and chat-based interfaces. Athena lets you create visualizations and automate workflows through natural language processing, so it's a good choice for businesses that want to try to automate their analytics.

