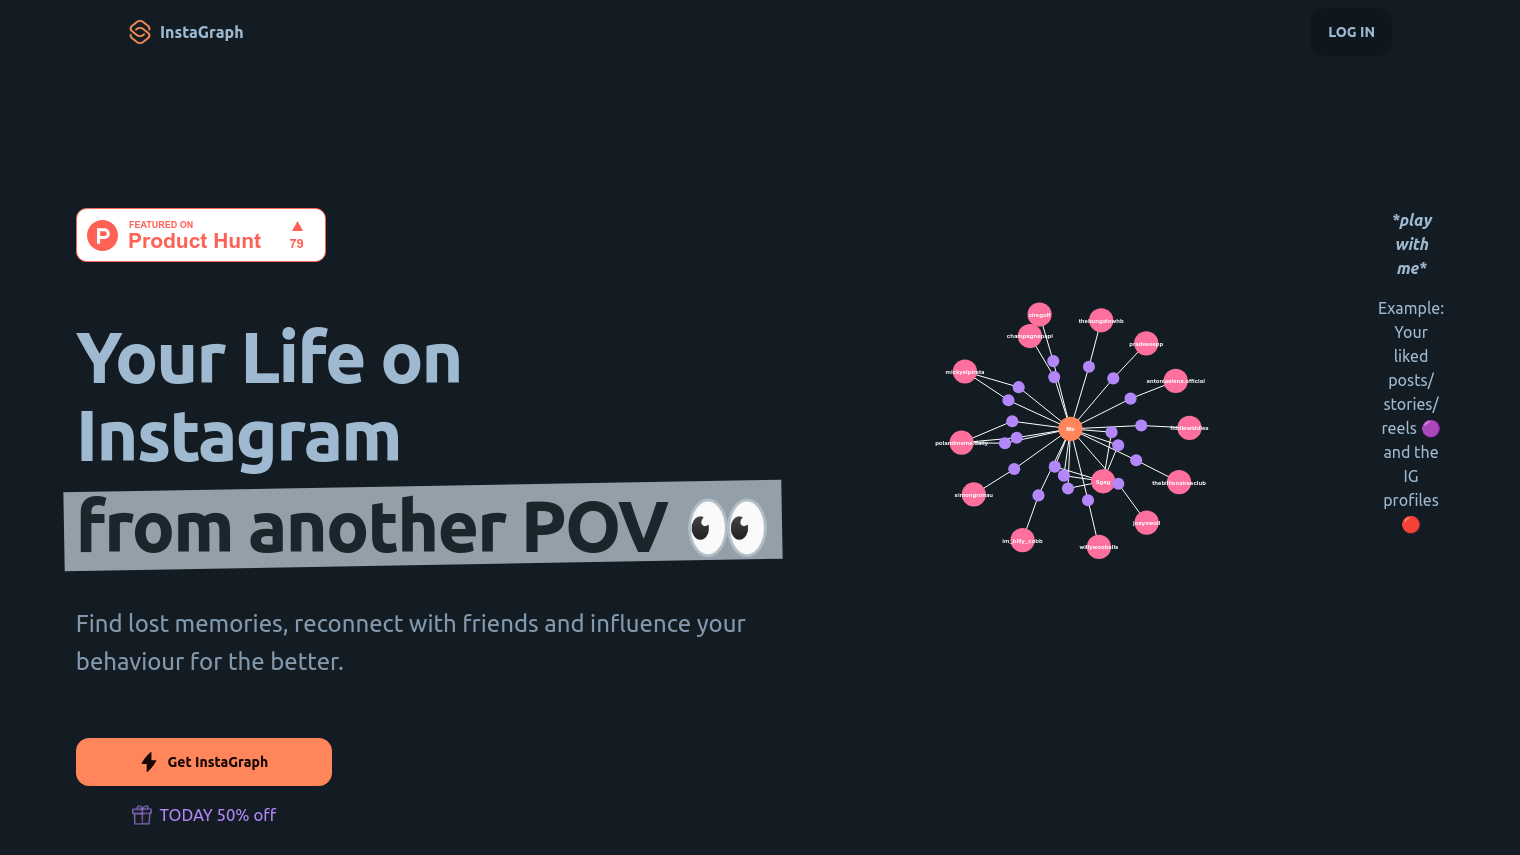
InstaGraph is a utility that lets you explore your own Instagram data in a more entertaining and interesting way. It can help you with some of the problems that come with Instagram use -- scrolling compulsion, sleep deprivation and distorted body image, for example -- by giving you a new way to see what you're doing.
The site offers four main graph options:
- Full Graph: All likes, going back as far as you want, and you can drag the dots to see more.
- Play Graph: Every second of your 24-hour activity, plotted starting from the earliest moment, so you can see how it accumulates.
- 3D Graph: Your graph in a three-dimensional view for maximum immersion.
- Window Graph: An animated view of your entire like history, with just a week's worth visible at a time.
You can tap on dots in your graphs to jump to the corresponding interactions. That'll let you explore every interaction in seconds. InstaGraph is for anyone with an Instagram account, whether you're using it for business, content creation or personal use.
InstaGraph doesn't ask you to log into Instagram. Instead, you can use the data from the official site or app, and InstaGraph doesn't store that data on its own servers. The tool runs the data locally on your own computer.
Here's how much it costs:
- One IG Account: $12 (initially $8) -- a one-time payment, not a subscription.
- Unlimited IG Accounts: $30 (initially $15) -- a one-time payment, not a subscription.
InstaGraph offers a refund if the tool doesn't work as advertised or if you have trouble accessing it. The idea is to help you better understand what you're doing with Instagram so you can be more mindful about your use and maybe even change your behavior for the better.
Published on June 9, 2024
Related Questions
Tool Suggestions
Analyzing InstaGraph...


