Question: Is there a platform that offers data visualization tools and integrates with other data tools like Excel and Power BI for better decision making?
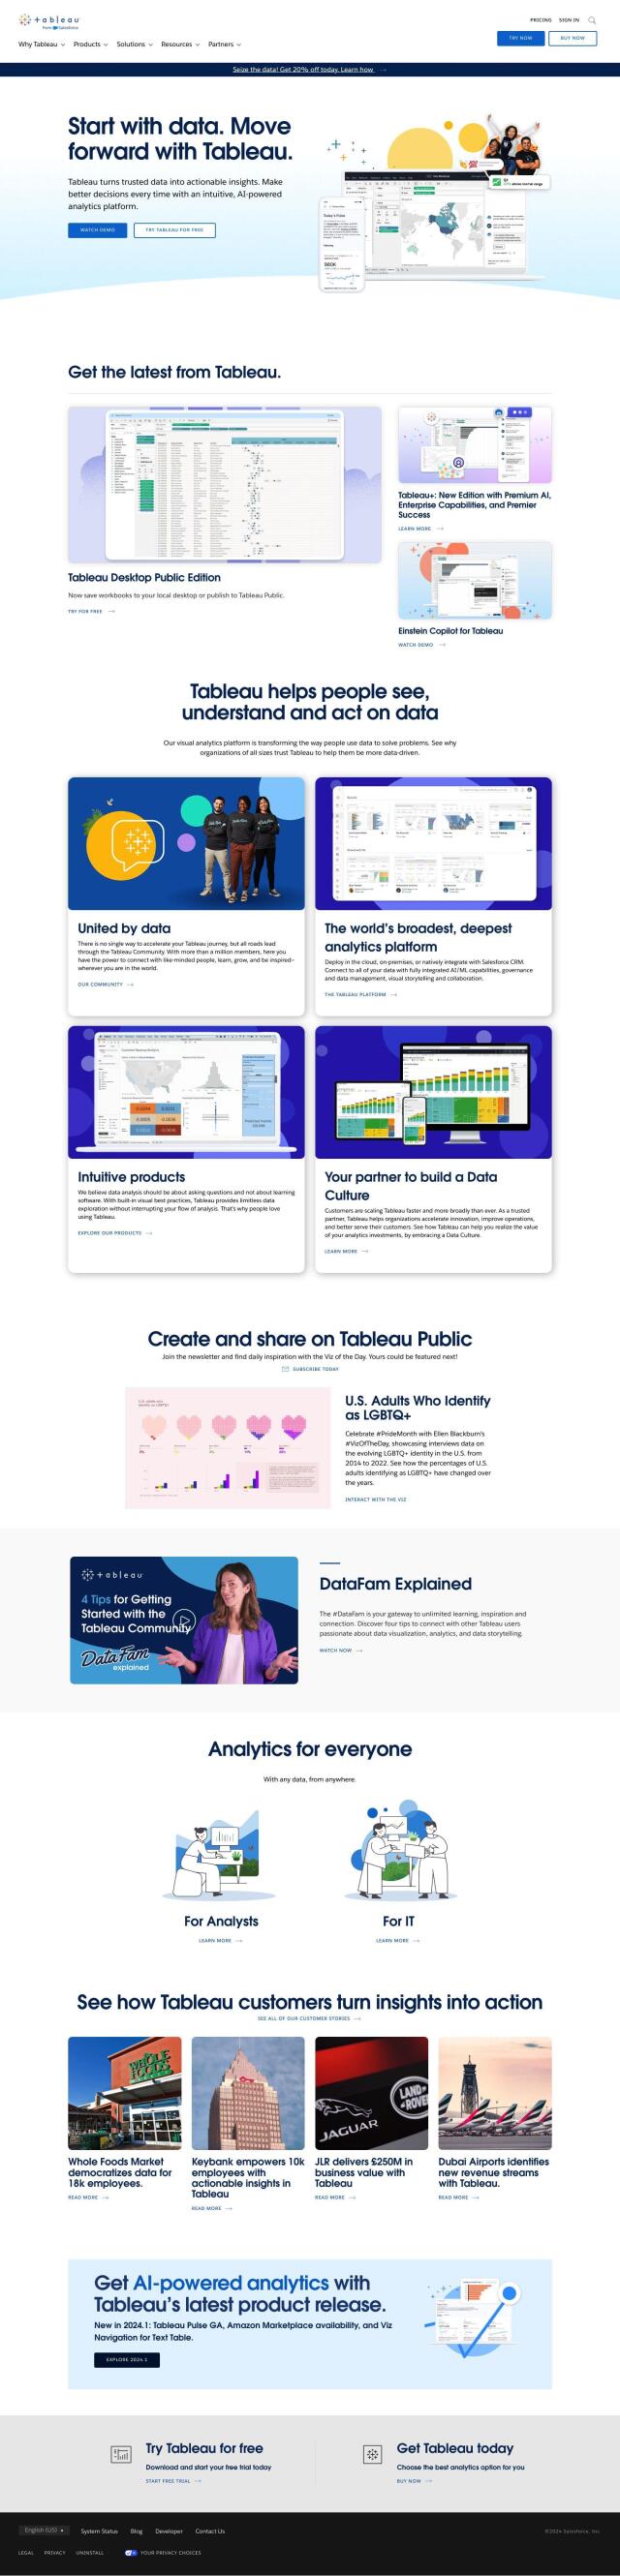
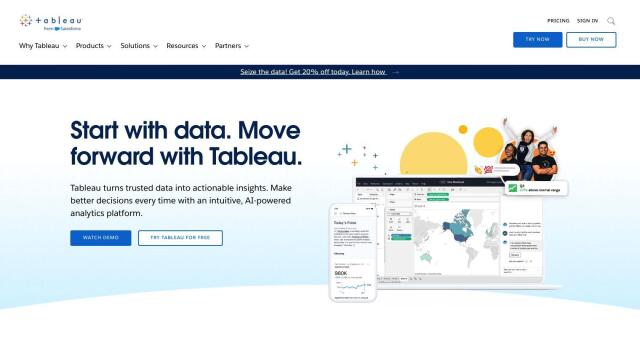
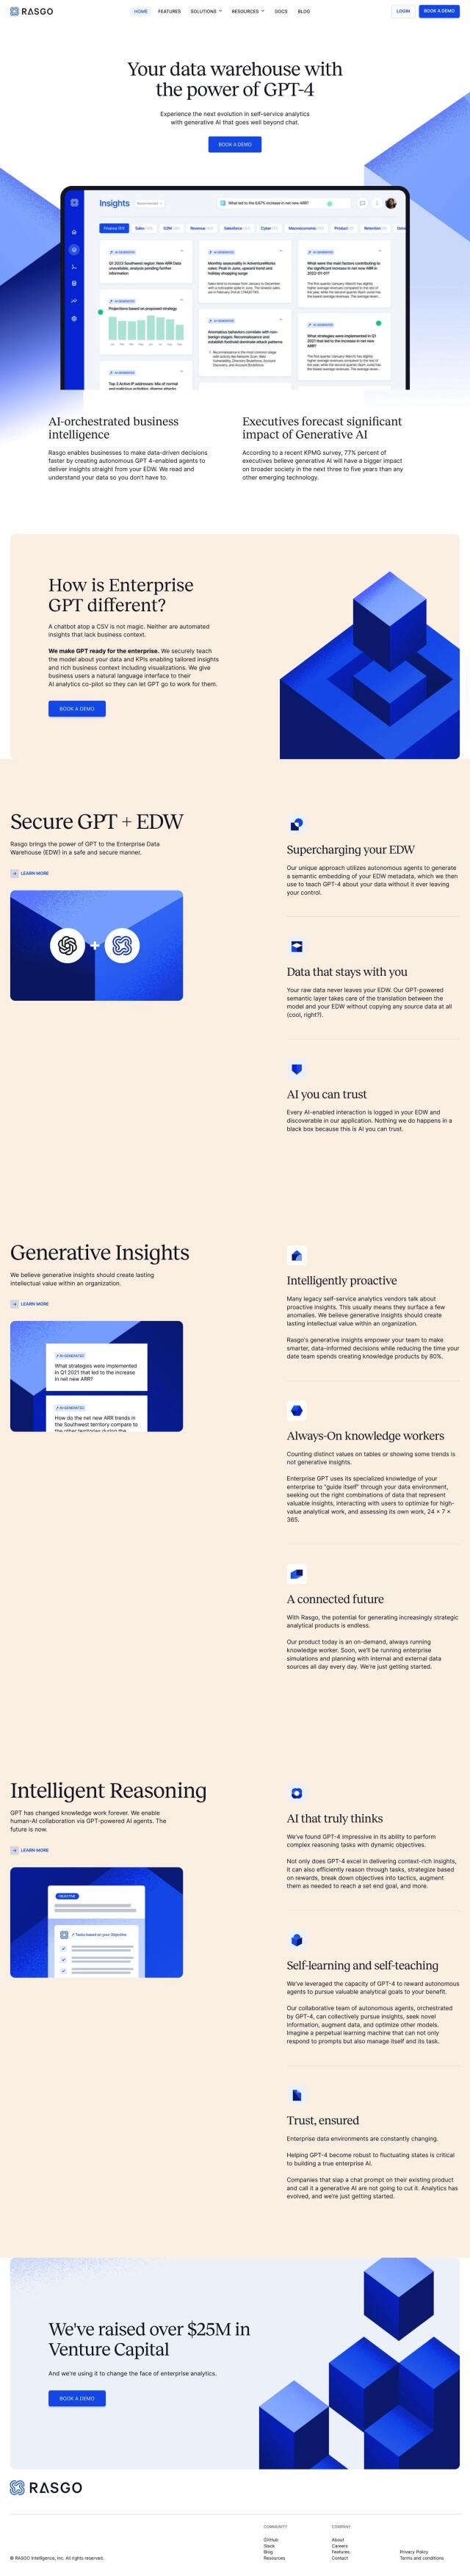
Tableau screenshot thumbnail

Tableau

If you're looking for a platform that's got data visualization tools and good integration with other data tools like Excel and Power BI, Tableau is a good choice. It lets you create visualizations through drag-and-drop interfaces and connects to a broad range of databases. Tableau offers many deployment options, including cloud and on-premises, and integrates with Salesforce CRM. It also has AI and ML abilities, governance features and a community approach, so it's good for decision-making and business optimization.

Microsoft Power Platform screenshot thumbnail

Microsoft Power Platform

Another strong contender is the Microsoft Power Platform. It includes Power BI for data visualization and integration with other Microsoft tools like Excel, so it's a good choice for decision-making. It also has low-code tools for building apps, workflows and AI-powered solutions, which can automate tedious tasks and improve business processes. The platform is widely used across many industries and has flexible pricing options, including a free Developer Plan.

Qlik screenshot thumbnail

Qlik

If you're looking for a full suite of data integration, analytics and AI tools, check out Qlik. It's got a rich data fabric, deep insights through data integration and a broad range of connectors to hundreds of data sources. Qlik's abilities include data streaming, application automation and AI-powered features, so it's good for a wide range of analytics needs. It's got flexible pricing options and a lot of resources to help customers get started with its products and develop data literacy.
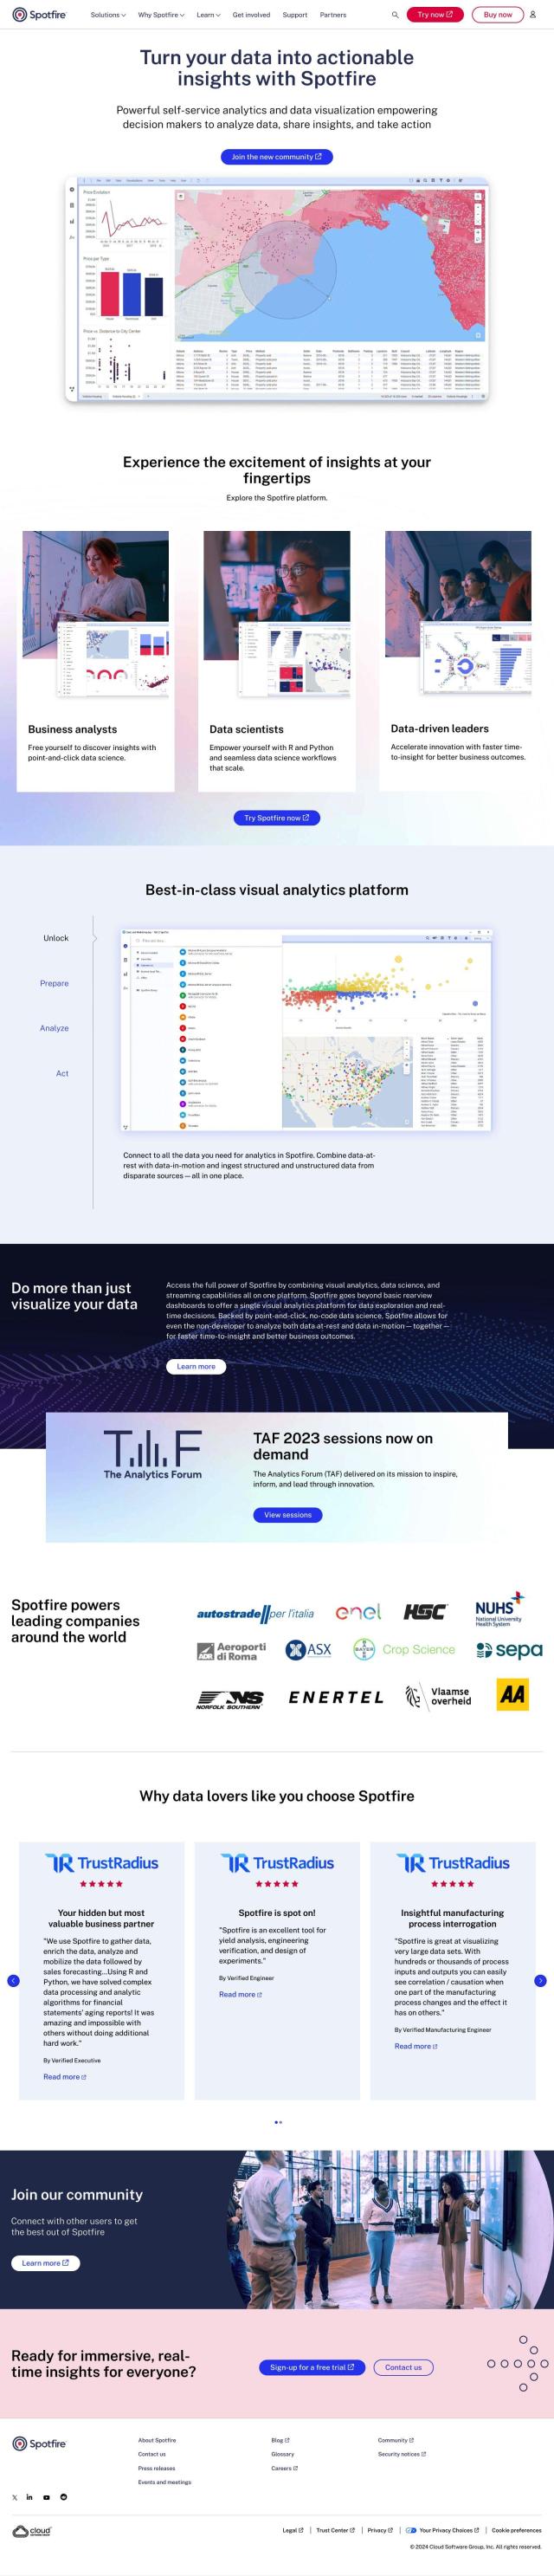
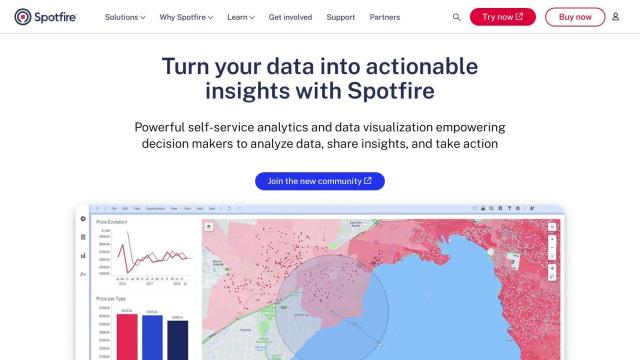
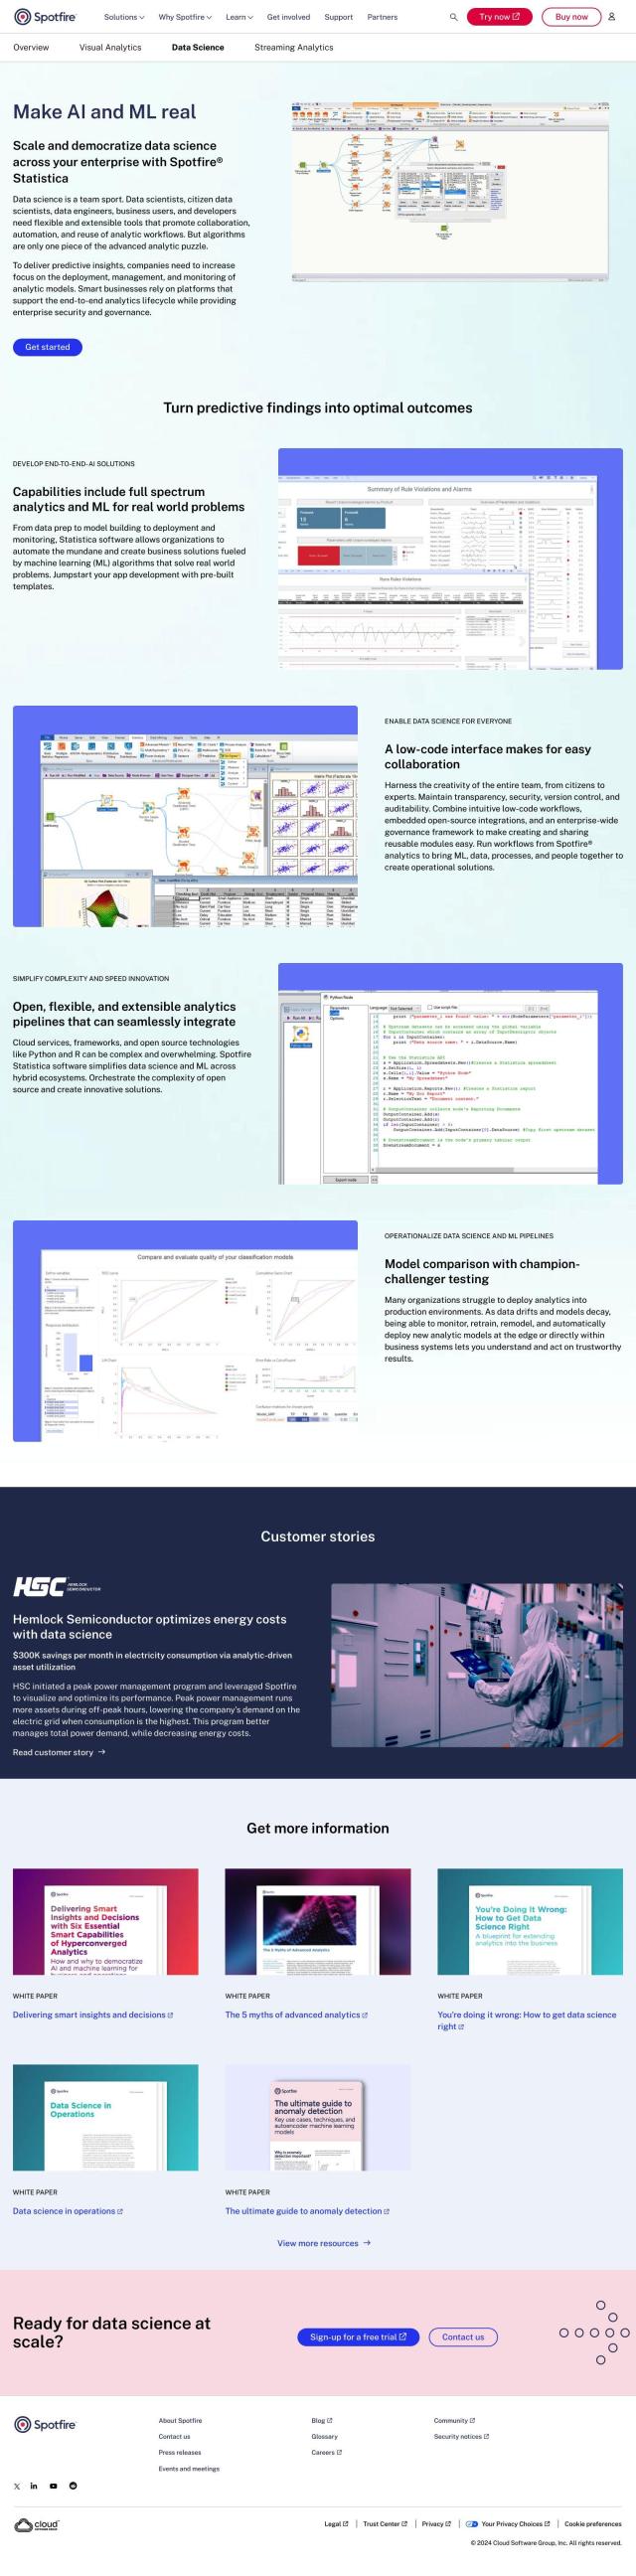
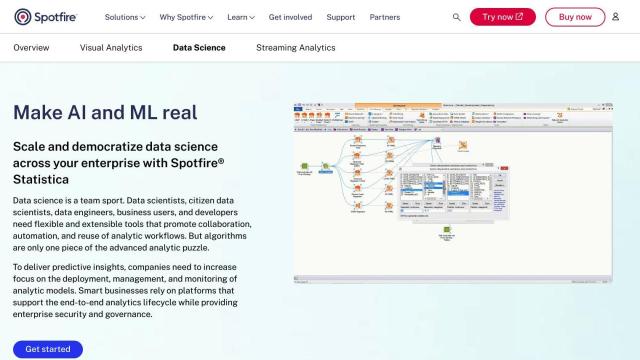
Spotfire screenshot thumbnail

Spotfire

Last, Spotfire is a powerful visual analytics tool that's good for both business analysts and data scientists. It's got self-service data visualization and advanced data science abilities, including integration with R and Python. Spotfire offers hybrid deployment and can handle structured and unstructured data, so it's good for a wide range of use cases for faster insights and better business results.

Additional AI Projects

Spotfire screenshot thumbnail

Spotfire

Combines self-service data visualization and advanced data science in a single workflow, empowering users to connect, analyze, and act on data for better business outcomes.

Sisense screenshot thumbnail

Sisense

Embed AI-infused analytics into products and applications with customizable look and feel, connecting data from multiple sources for personalized insights.

ThoughtSpot screenshot thumbnail

ThoughtSpot

Ask complex data questions in natural language and get instant AI-powered insights, empowering informed business decisions without requiring SQL or data expertise.

Domo screenshot thumbnail

Domo

Unifies data from any source, providing AI-driven insights and automation to drive real-time decisions and meaningful actions across the organization.

Sigma screenshot thumbnail

Sigma

Combines spreadsheet-like data analysis with large-scale data handling, integrating trusted AI models for secure, auditable, and collaborative decision-making workflows.

MicroStrategy screenshot thumbnail

MicroStrategy

Build AI-infused business intelligence apps with rapid integration, cloud-native design, and natural language querying for faster insights and confident decision-making.

OWOX BI screenshot thumbnail

OWOX BI

Connects corporate data and spreadsheets, enabling better business insights and decisions through automated reporting, data blending, and collaborative access.

Tabula screenshot thumbnail

Tabula

Automate data workflows, standardize disparate sources, and gain real-time insights without coding, empowering data-driven decision-making across departments.

datapine (RIB BI+) screenshot thumbnail

datapine (RIB BI+)

Empower data-driven decision-making with self-service analytics, combining data from multiple sources into a single, secure point of truth.

GoodData screenshot thumbnail

GoodData

Quickly build custom data products with interactive analytics abilities, leveraging AI-powered features like a no-code interface and chat assistant for effortless insights.

Onvo screenshot thumbnail

Onvo

Create interactive charts and insights with simple AI prompts, eliminating the need for complex queries and customizations.

Mode screenshot thumbnail

Mode

Unify data analysis and visualization with SQL, R, Python, and interactive dashboards to accelerate insights and collaboration across teams.

Polymer screenshot thumbnail

Polymer

Converts complex data into intuitive, actionable visualizations, linking multiple sources and generating real-time insights with AI-driven analytics and suggested trends.

Breadcrumb screenshot thumbnail

Breadcrumb

Transform data into interactive AI dashboards, connecting multiple sources, and track trends in real-time with 100% accurate visualizations and natural language queries.

Airbook screenshot thumbnail

Airbook

Accelerate data analysis and insights generation across teams with native connectors to 150+ data sources, collaborative querying, and visualization tools.

Hex screenshot thumbnail

Hex

Unify data teams with AI-assisted exploration, collaboration, and interactive reporting, accelerating data work and improving accuracy in a single, modular workspace.

Canvas screenshot thumbnail

Canvas

Link, query, and visualize data from 150+ SaaS tools without coding, empowering non-technical teams to make data-informed decisions.

DataChat screenshot thumbnail

DataChat

Access complex data insights without coding, using a familiar chat and spreadsheet interface to generate transparent, reproducible results.

Databricks screenshot thumbnail

Databricks

Unifies data, analytics, and governance, enabling users to build, deploy, and manage AI applications directly on their data with ease and control.

Rasgo screenshot thumbnail

Rasgo

Ask plain language questions and get instant, automated insights with 24/7 intelligent analysis, secured and customized with business context and visualizations.